TRUSTED FINANCIAL MARKETS INSIGHTS
Innovation meets simplicity
COMPARE STOCKS
Compare stocks made easy
Sector Analysis
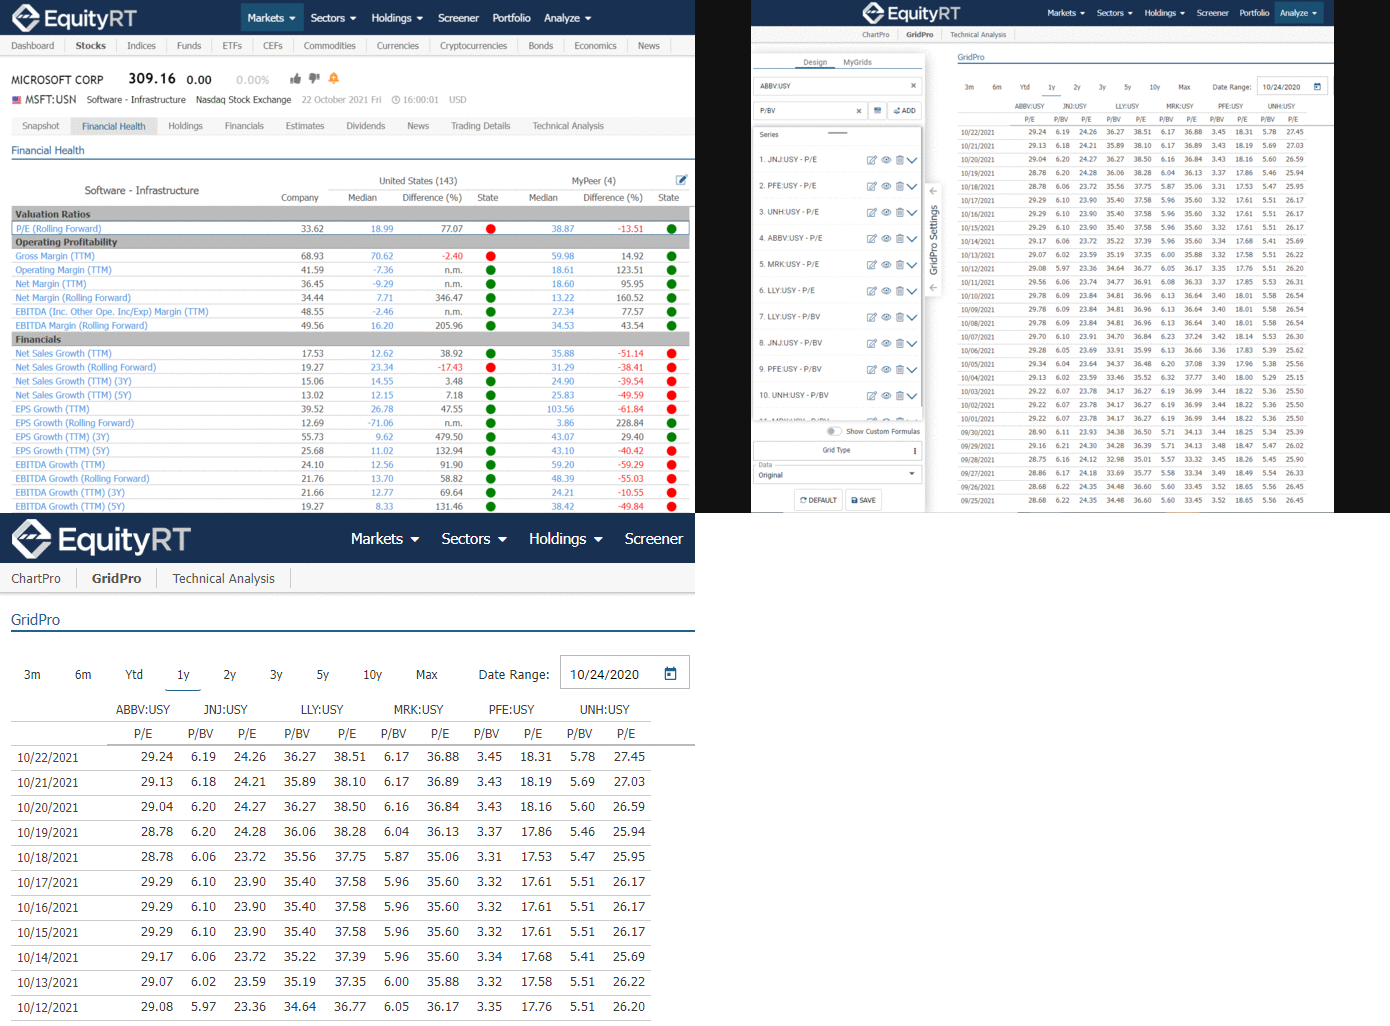
Understanding how a stock stacks up against its peers provides valuable insights into qualifying your investment opportunities. EquityRT™ gives you many ways to compare peer financial data whether it’s market data or financial comparables.
Financial Benchmarking
Easily compare a stock’s financial health against industry medians or benchmark against your custom group of peer stocks. We do the hard work for you so you can get answers in a single click.
Easily compare stocks in a customized table
Create customized data tables online to compare key information amongst peers. We give you the flexibility to compare data at a point in time or in a time series.
market trends
Discover market trends and new insights
Uncover stock signals from in depth fund analysis
Paying close attention to market trends reveals hidden signals that will support your stock market research. Fund holdings are broken down by stocks and sectors giving you additional intelligence into stock selection. See which are the popular stocks that fund managers and company insiders have increased their share holdings in.
Get that bird’s eye view of Industry Sectors
User the power of sectoral stock recommendations to get a unique perspective into the expected performance of the industry sectors in the market.
STOCK Screener
A click away from a smart investment idea
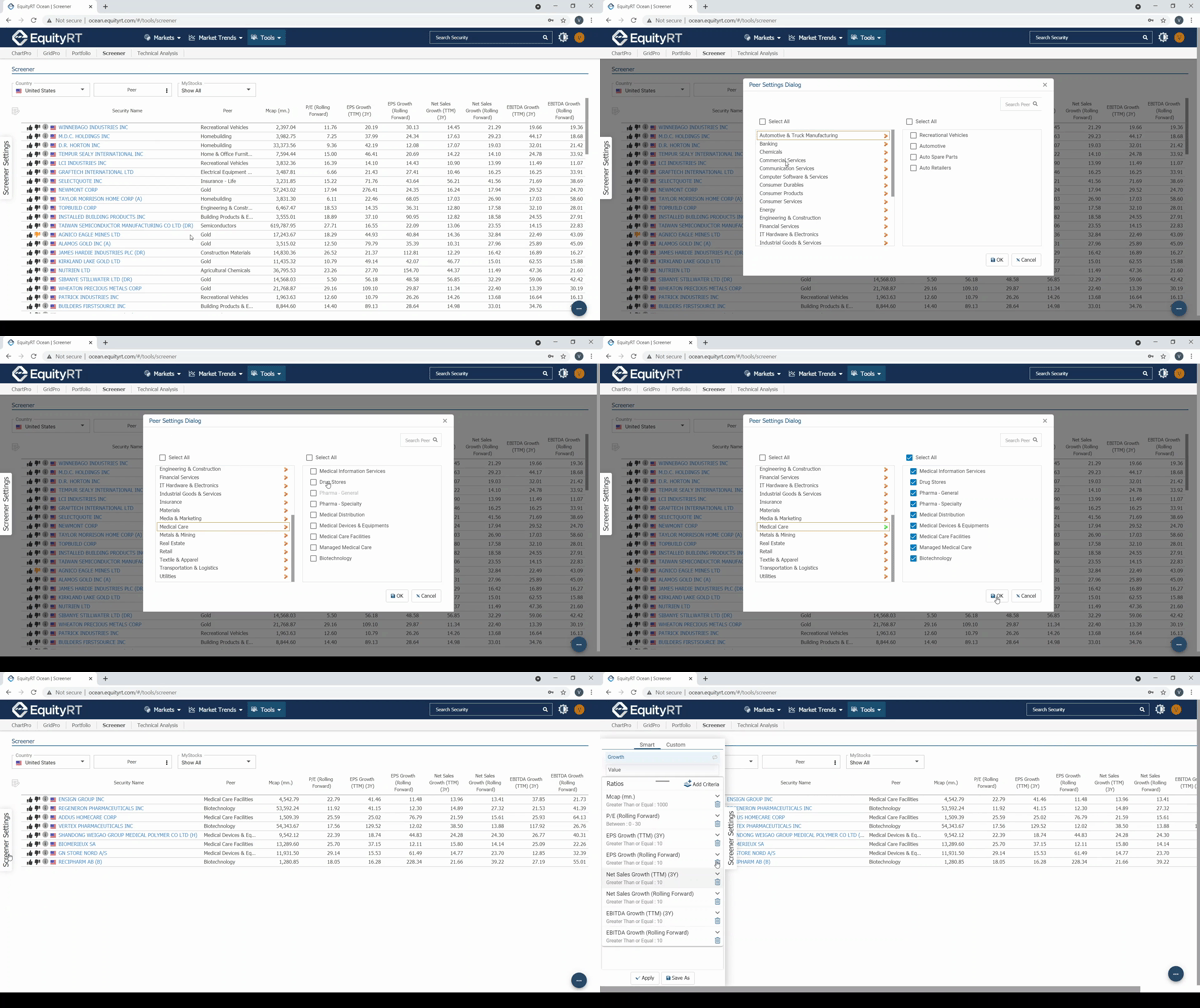
Selecting good stocks is no easy task. With so many choices out there zoning in on the good ones requires a robust screening process. Our Stock Screener does just that. With a few clicks you can apply your proprietary custom criteria to a set of stocks to find the smartest investment ideas. You are also equipped with Smart Screeners that are already set up with popular criteria for quick screening.
Add a new dimension to your screening criteria by including market trends, shareholder analysis and stock signals. EquityRT™ advancing the way you screen stocks.
Chartpro
Simple Advanced Charting
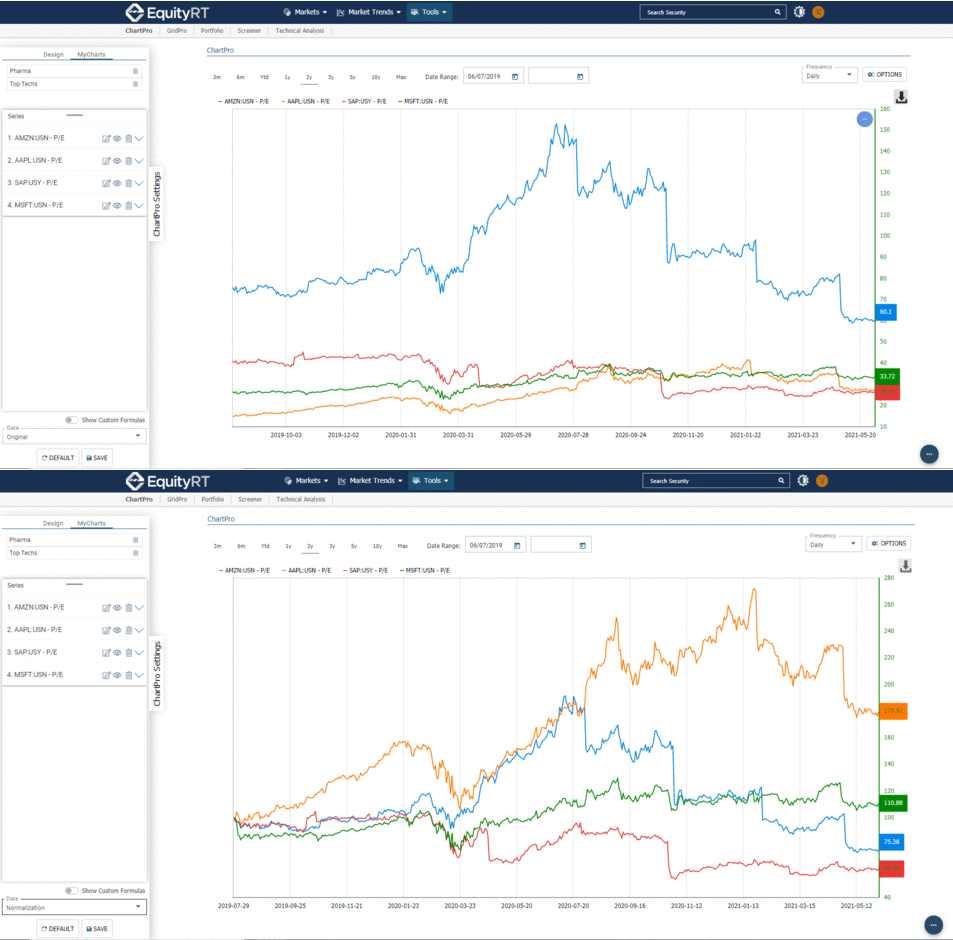
Use the power of graphics and visuals to create the best picture to tell your story. Chart anything quickly and easily from price data to fundamental ratios and economic indicators. Conduct time series on a single stock or easily create comparisons with peers’ stocks or economic indicators.
portfolio
Stay on top of your Portfolio Returns
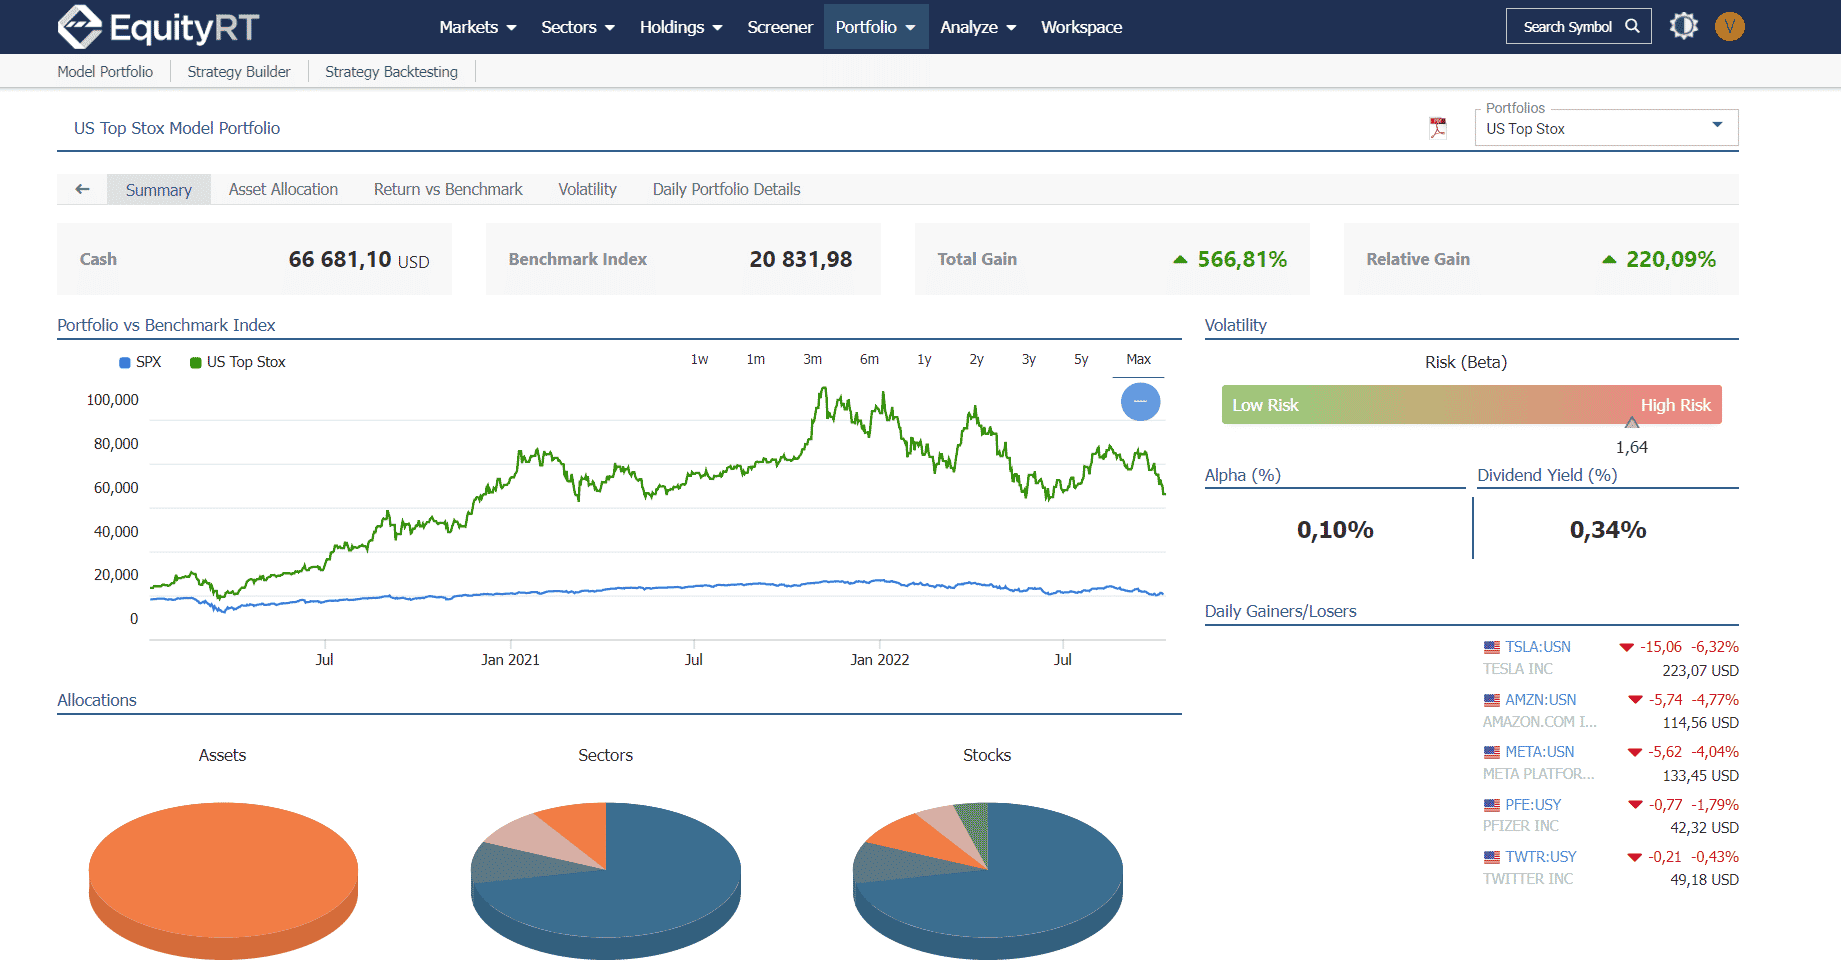
Keep your finger on the pulse of your portfolio’s performance. Easily build, track and manage your model portfolios for your diverse client base. A simple and clean interface makes the management of your portfolios fun.
EquityRT Connect
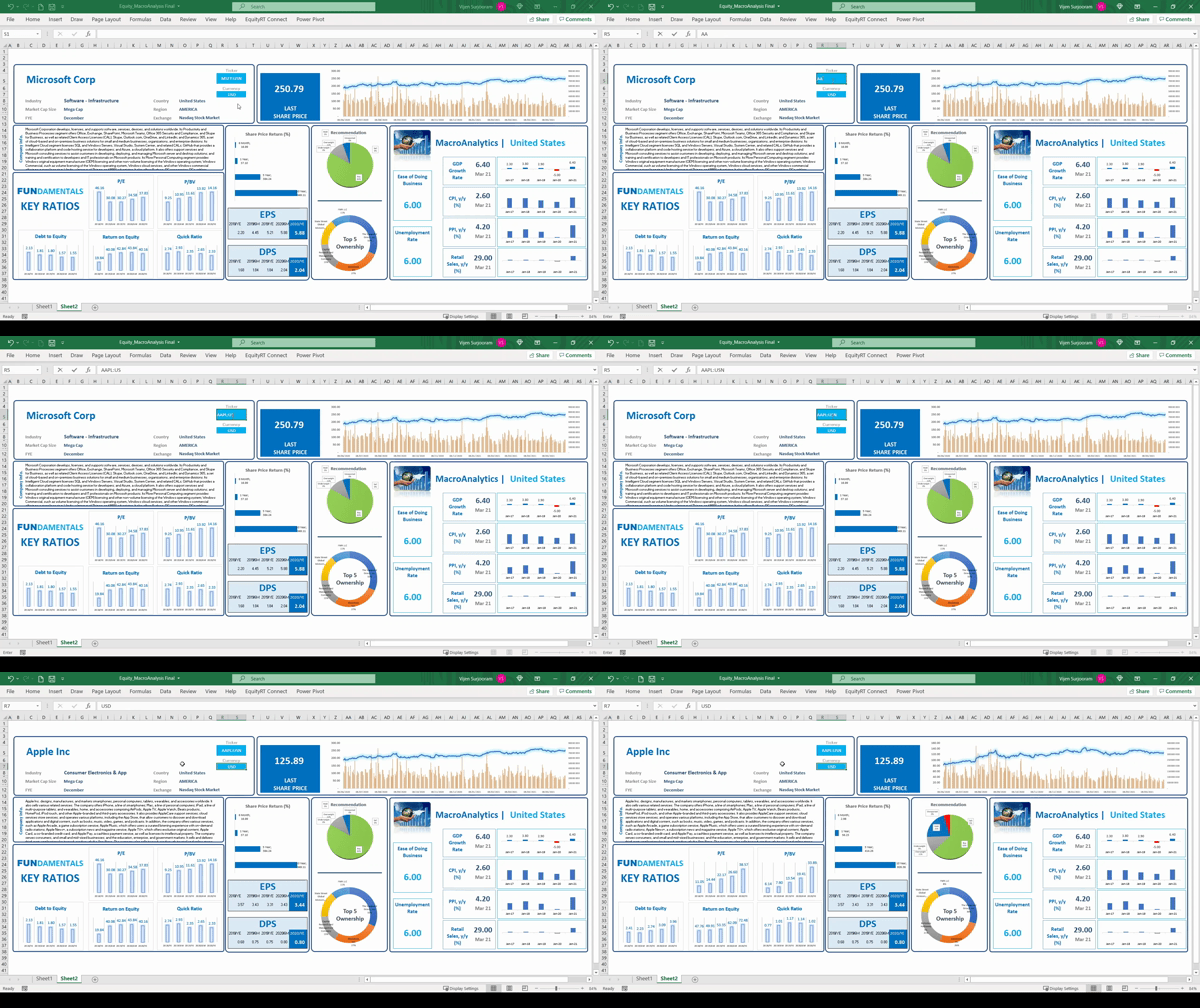
Get your day back with EquityRT™ Excel Addin
Most of the data you analyze will find its way to excel. Our Excel Add-in automates complicated and repetitive analytics giving you precious time back to spend on more important activities like a game of golf or a longer coffee meeting with that prospective client. Using our simple syntax you don’t have to be an Excel expert to benefit from the excel addin. To make things easier we have a range of ready-to-use excel templates and a smart technical team to assist you with your model building. The possibilities are endless.
