Latest economic facts about Canada :
- Canada is one of the wealthiest nations in the world. With a $1.6 trillion GDP, Canada is ranked as the ninth-largest economy after Italy.
- The services industry is dominant and accounts for 70% of the GDP while manufacturing and agriculture industries account for 28% and 2% of the gross output, respectively.
- In 2020, the GDP per capita in Canada was above $43,000.
- Canada is the second-largest country in the world in terms of area size after Russia.
- In 2020, the total population in Canada is estimated at 38 million inhabitants according to the IMF.
- Canada offers an abundance of natural sources such as gold, coal, nickel, crude oil. The country has the second-largest oil reserves in the world.
- Canada is one of the leading producers and exporters of crude oil. Canada’s GDP is inversely impacted by lower oil prices.
- Western Canadian Select is one of the largest heavy oil benchmarks in North America.
- In 2020, Canada earned USD 434 billion from exports and spent USD 465 billion on imports.
- Canada recorded 1.3 million cases since the epidemic began, according to the World Health Organization.
- The cumulative number of COVID-19 vaccine doses administered in Canada was 24 million, as of June 2, 2021, according to the national Public Health Agency.

Growth
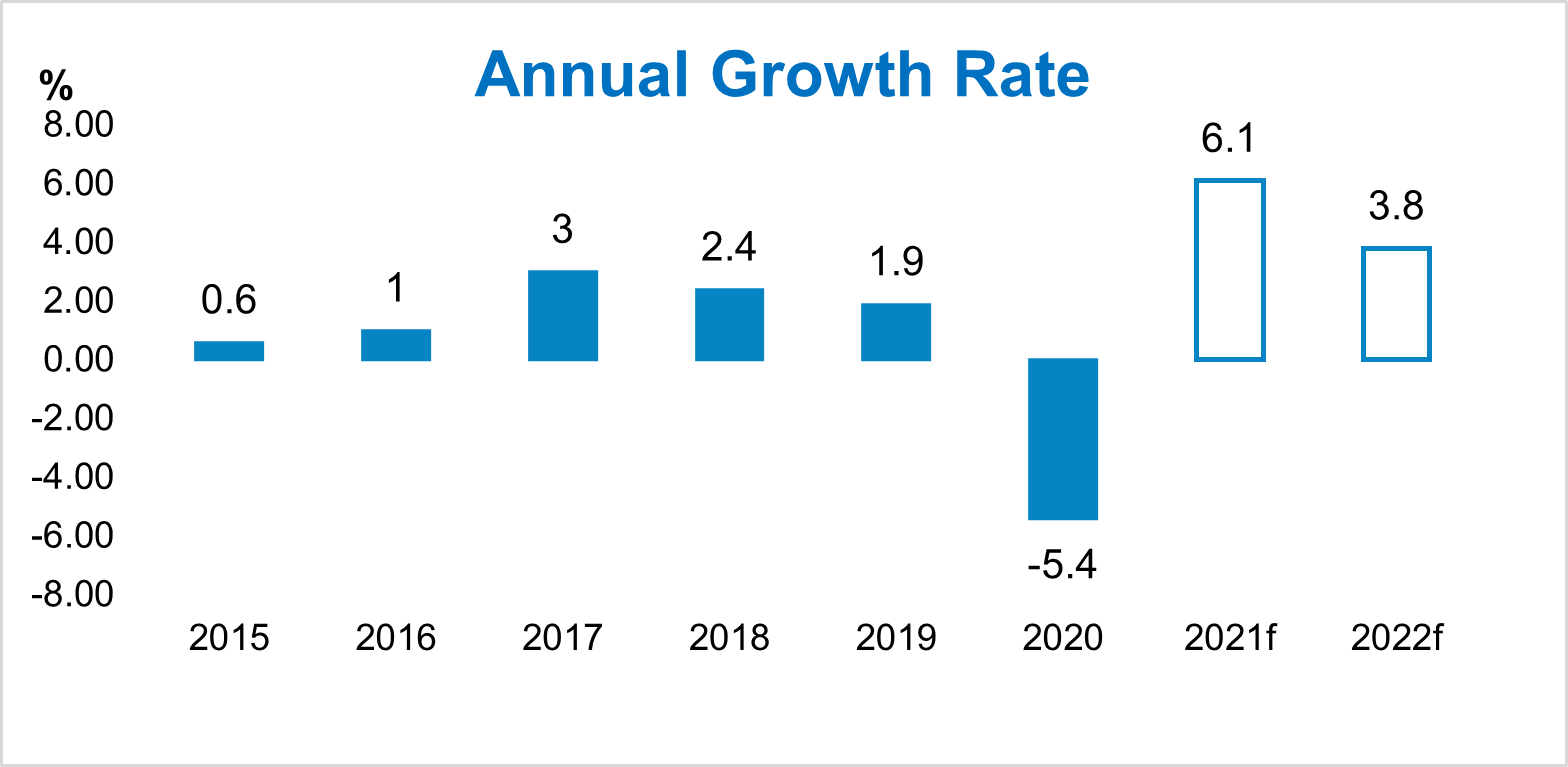
The Gross Domestic Product (GDP) expanded at an annualised rate of 5.6% in the first three months of 2021.
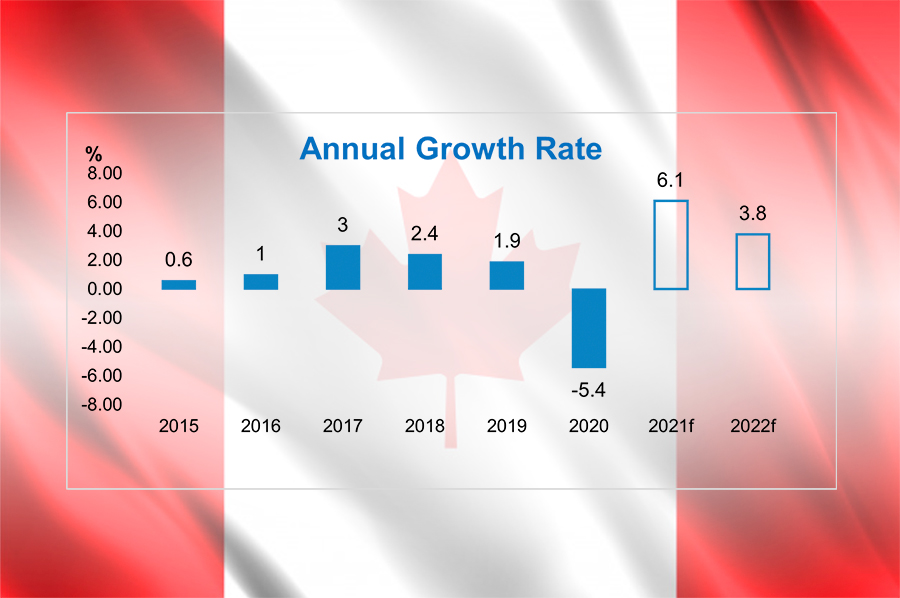
Canada’s annual GDP growth was -5.4% in 2020. GDP Growth Rate averaged 0.7 percent from 2010 until 2021.
In its recent outlook report, the OECD expects the Canadian economy to grow by 6.1% in 2021 and 3.7% in 2022.
Inflation
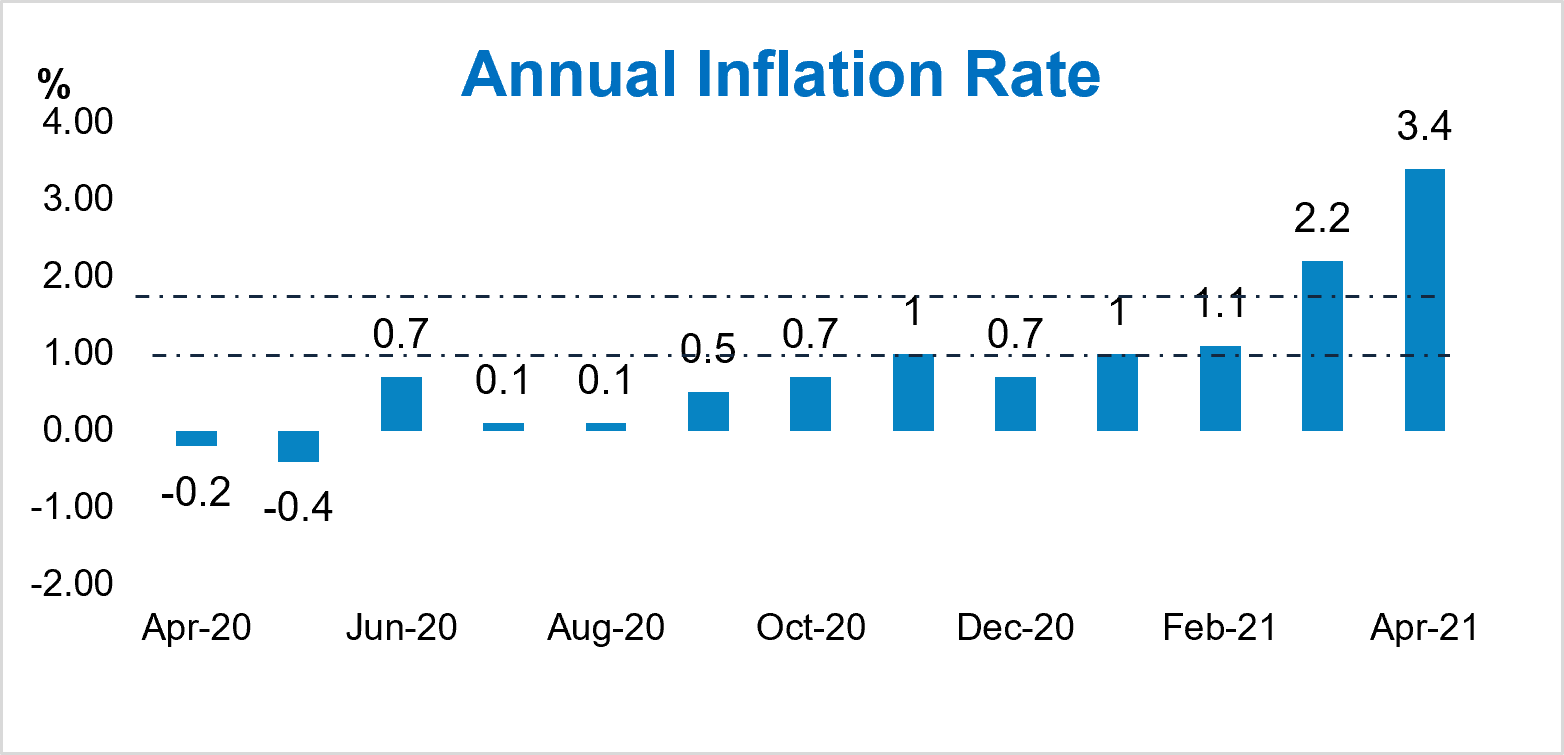
In 2020, the average inflation rate in Canada was 0.7 percent compared to 2019.
The inflation rate in Canada rose to 3.4% in April 2021 from 2.2% in March 2021. This is the highest level in nearly a decade.
The OECD expects inflation in Canada to reach 2% in 2021 and 1.4% and 2022.
The central bank’s medium-term inflation target range is 1 to 3.
Inflation is the rate of increase in prices of goods and services over a given period.
Unemployment Rate
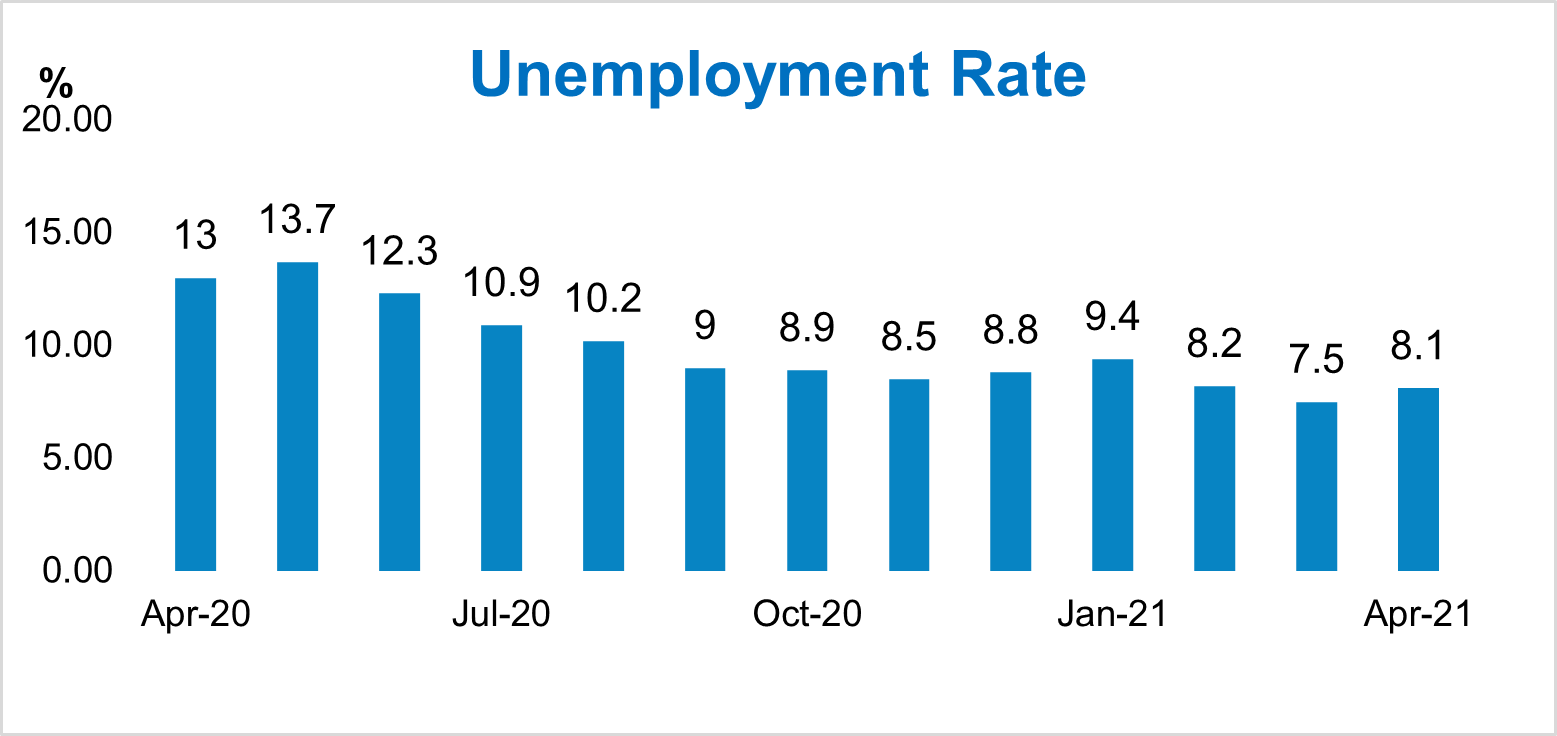
In 2020, the unemployment rate in Canada was around 9.6%.
Canada’s unemployment rate is at 8.1% as of April 2021. The rate hit its lowest level (7.5%) in March 2021 since the start of the Covid-19 pandemic in March 2020.
The OECD expects the unemployment rate in Canada to fall to 7.9% in 2021 and 6.8% in 2022.
The unemployment rate measures the proportion of Canadians (aged 15 and above) who does not currently have a job and is available for work.
Government 10Y Bond Yield
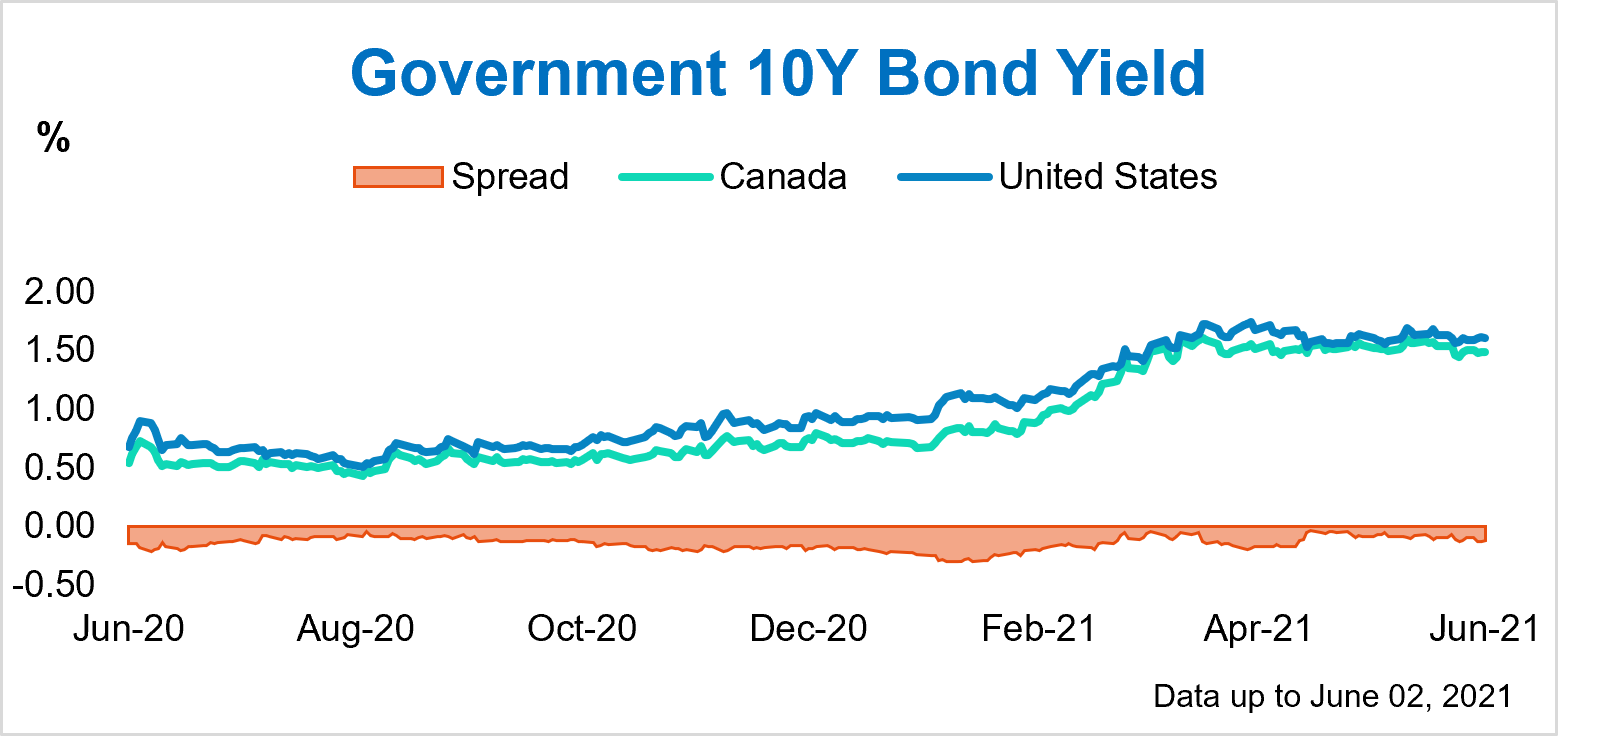
10-year Canadian bond yield is 1.49% as of 02 June 2021. It was 0.54% a year ago.
The Canada 10-year bond yield changed +4.2 bp during last week, +5.5 bp compared to last month and +95.4 bp compared to last year.
The yield hit its minimum level of 0.44% on 4 August 2020.
A rising yield indicates decreasing demand for treasury bonds.
Currency
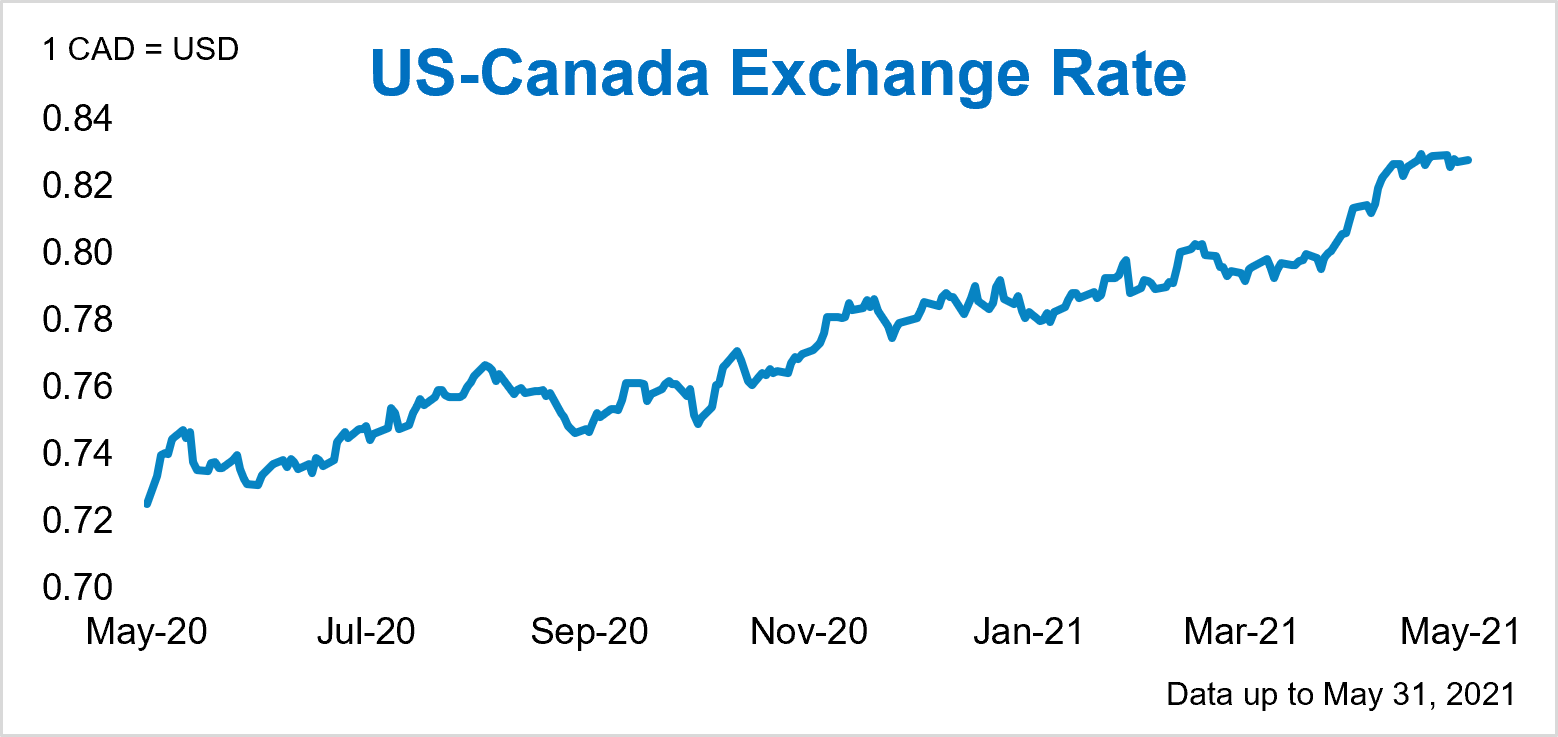
CAD to USD is the price of the Canadian dollar in relation to the US dollar.
As of 31 May 2021, 1 Canadian dollar costs 0.82 US dollars.
A year ago, 1 Canadian dollar cost 0.72 US dollars.
The Canadian dollar is expected to trade at 0.82 in 12 months.
The Canadian dollar is often known as “the loonie” because of the loon bird on the $1 Canadian coin.
Central Bank Total Assets
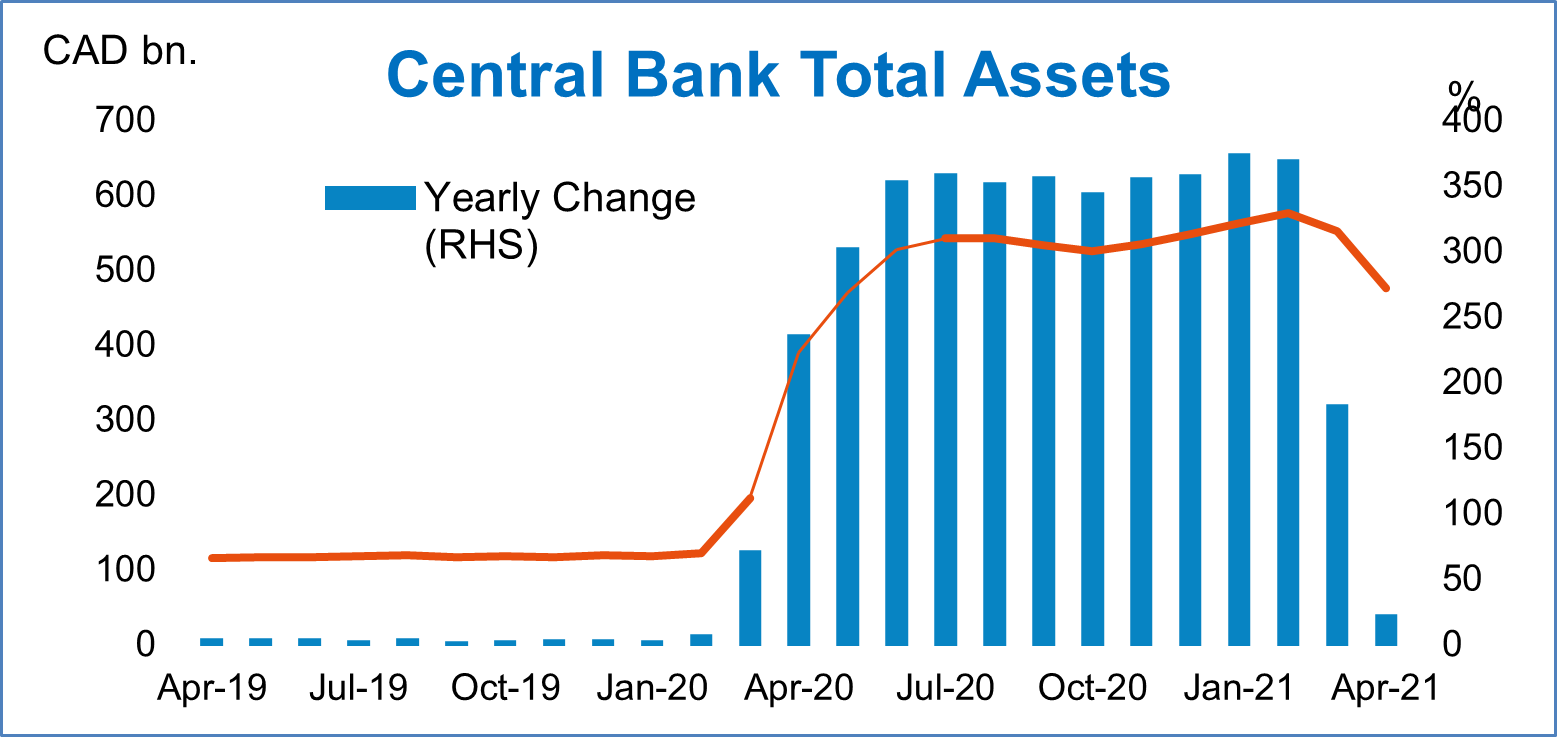
The total assets of the central bank in Canada are CAD 476 billion as of April 2021.
At the beginning of 2020, the Bank’s total assets were below CAD 120 billion. The Bank’s asset purchases have grown its balance sheet substantially in 2020.
The balance sheet reached up nearly CAD 577 billion in February 2021. This was four times bigger than the pre-pandemic levels.
Canada’s central bank started to seize its bond-purchasing program.
Effective from the week of April 26, the purchases were adjusted to a target of CAD 3 billion from CAD 4 billion.
Source: OECD, IMF, National sources via EquityRT MacroAnalytics
Report by Özge Gürses | Macro Research at EquityRT
2021-06-10
Economic indicators for over 200 countries available through EquityRT
Contact us to get started with your free-trial of EquityRT MacroAnalytics.
