
info@equityrt.com
  • 
  • 
  • 
  • 
  • 
  • U.S.
  • EUROPE
  • AFRICA
  • ASIA
  • PACIFIC
EquityRT
    • About Us
      • Who Do We Help
        • Global Footprint
          • In The News
            • Blog
            • Press
          • Stock Market Data Analysis
            • Strategy Building & Backtesting
            • Portfolio Management
            • Financial Charting
            • Stock Screener
            • Sector Analytics
            • Stock Holder Analysis
            • Excel for Financial Analysis
          • Specialized Data Solutions
            • Automated Data Delivery
          • Industries
            • Investment Management
            • Financial Advisory and Wealth Management
            • Economic Research and Academia
            • Investor Relations and Corporates
            • Consulting and Advisory Services
          • Global Support
            • support@equityrt.com
          • General Enquiries
            • info@equityrt.com
          • Knowledge Hub
            • Financial Glossary
            • Market Research
            • Equity Research
            • Economic Research
            • Analytical Tools
        • Plans
        • Login
        • Get Started
          • About Us
          • Who Do We Help
          • Global Footprint
            • Blog
            • Press
            • Strategy Building & Backtesting
            • Portfolio Management
            • Financial Charting
            • Stock Screener
            • Sector Analytics
            • Stock Holder Analysis
            • Excel for Financial Analysis
            • Automated Data Delivery
            • Investment Management
            • Financial Advisory and Wealth Management
            • Economic Research and Academia
            • Investor Relations and Corporates
            • Consulting and Advisory Services
            • support@equityrt.com
            • info@equityrt.com
            • Financial Glossary
            • Market Research
            • Equity Research
            • Economic Research
            • Analytical Tools
        • Plans
        • Login
        • Get Started

        Smarter, easier and faster investment research

        EquityRT is a trusted financial market research and data analytics platform, that is designed to empower the professionals in the investment industry.

        Try Now
        Request Demo
        • Why you should choose EquityRT?
        • Winning Features
        • Insights and Data
        • Why you should choose EquityRT?
        • Winning Features
        • Insights and Data
        1. Home
        2.  » Stock Market Data
        Why you should choose EquityRT?

        Optimize your Investment Strategy with

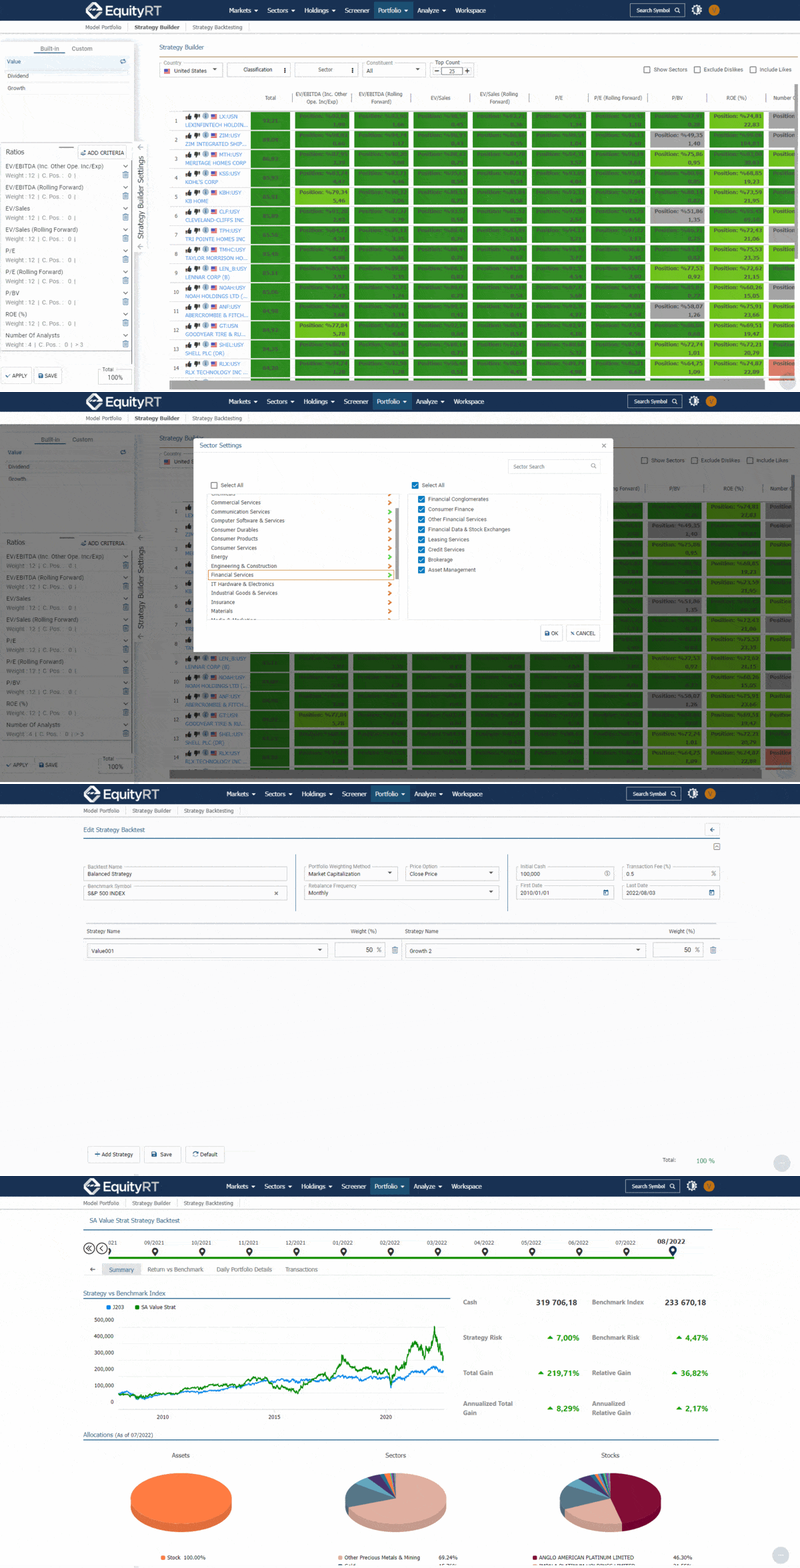
        EquityRT Strategy Builder and Backtesting

        Portfolio managers, equity research analysts, economists and many other investment professionals are constantly challenged to deliver quality research to guide the right investment decisions.

        Making the right decisions starts with having an optimum investment strategy in place. EquityRT’s unique investment strategy builder and backtesting super-feature gives you the easiest way to design a fundamental based investment strategy, and back test its effectiveness in just a few clicks.
        Flexible Access

        No installs or download needed. Access EquityRT anytime anywhere, giving you the mobility you need in todays world.

        Speed & Efficiency

        Simple intuitive analytical tools, visually insightful screens and logically structured data lets you spend more time in analysis mode.

        Relevant & Insightful

        Consistent expansion of data coverage and innovation of platform features keeps your analysis relevant and insightful.
        Winning Features

        It’s all about experience

        Simple, intuitive and customizable

        Model Portfolio

        Lose the spreadsheet and keep track of your model portfolios online with ease. All your portfolio information is pulled together in one place keeping you in control of your investment returns.
        The next level of charting

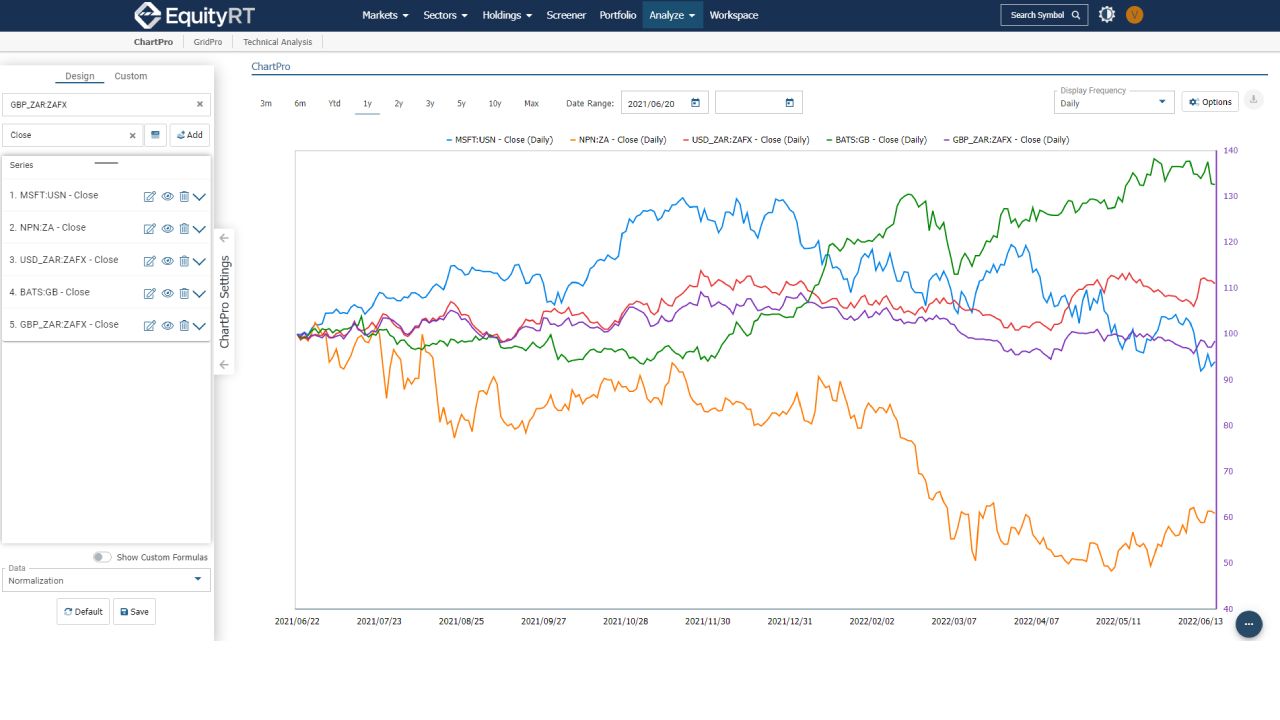
        Enjoy the new advanced charting application, jam-packed with new features that allows for detailed customization of your charts. From fundamental to economic charting, custom time series design or basic price charting – it all can be done here in just a few clicks.

        Create data tables online

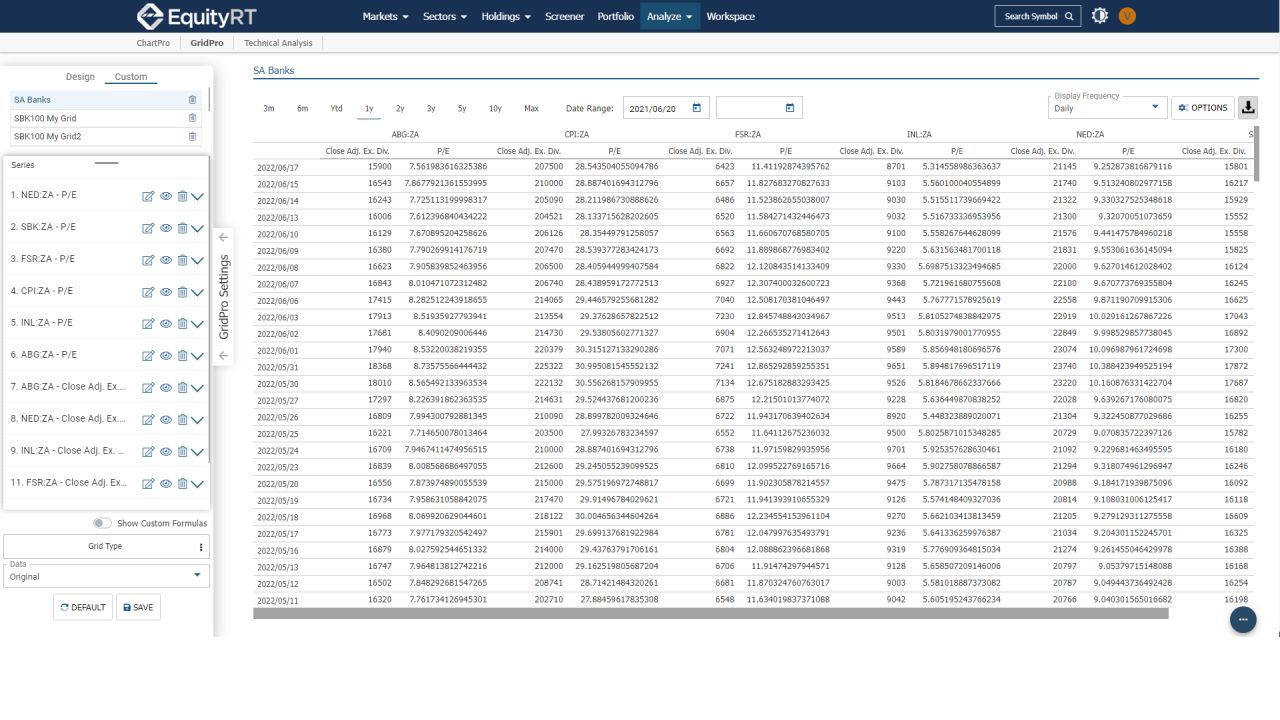
        There is no longer a need to export huge chunks of data and then re-organise it in excel. We have made it easy for you to create customised data tables online, for the data you need and in the format you want.
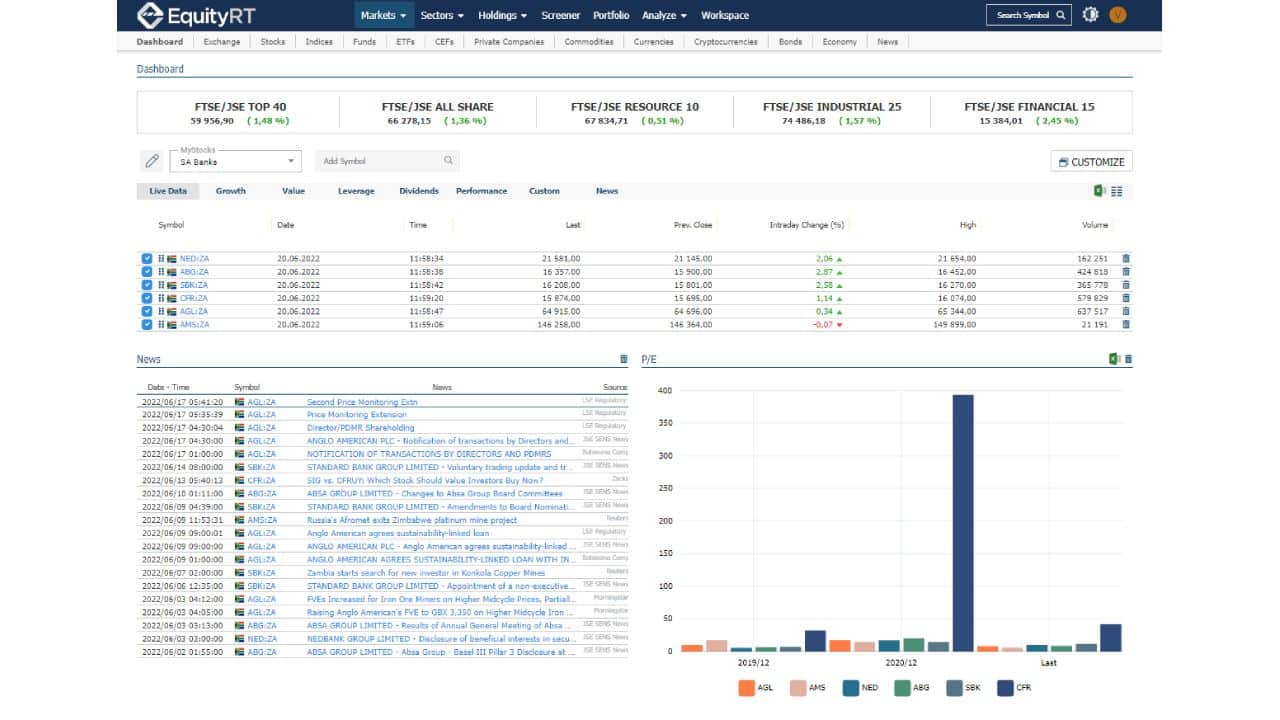
        Interactive dashboard

        Innovative customizable dashboard bringing together key market monitoring components helping you to keep your finger on the pulse in a single view. Create multiple watchlists of stocks. Easily switch between current day market data and key fundamental indicators of your most watched stocks, conveniently grouped into “Growth”, “Value”, “Leverage”, and “Dividend” categories.

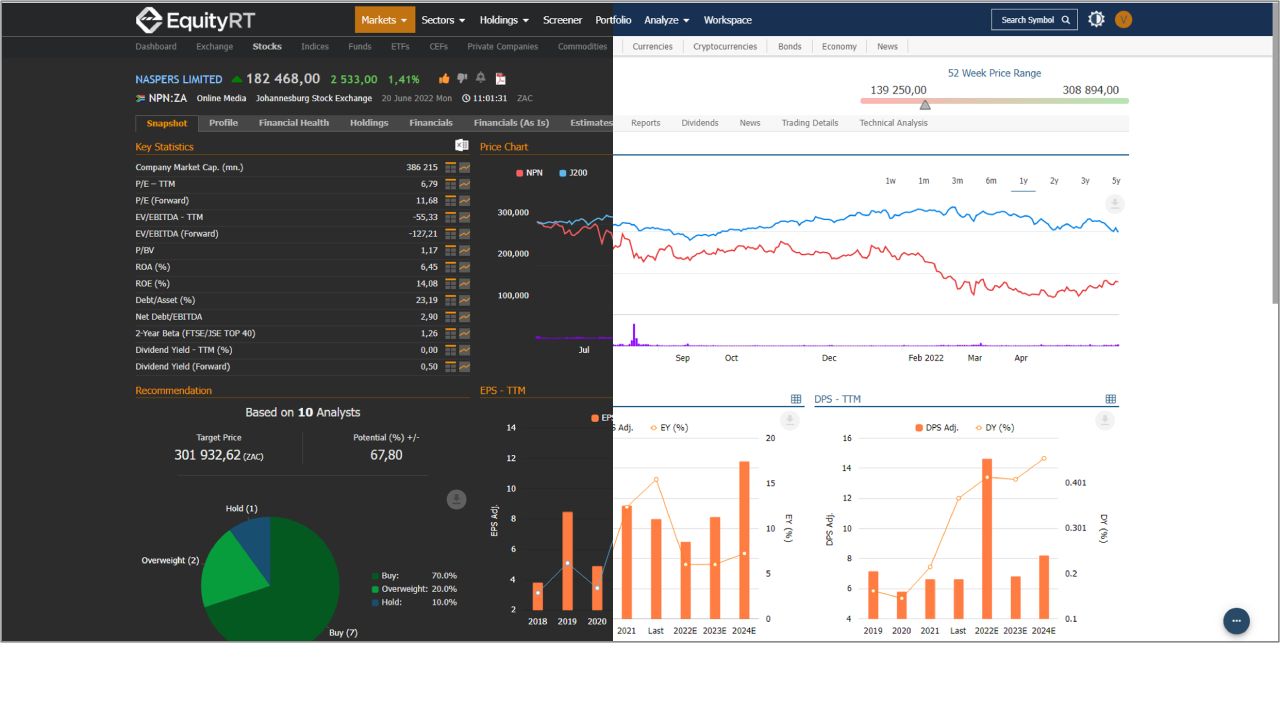
        Fresh modern interface

        A fresh, crisp and super-fast user interface with an ergonomically friendly layout makes it quick and easy to find what you are looking for.
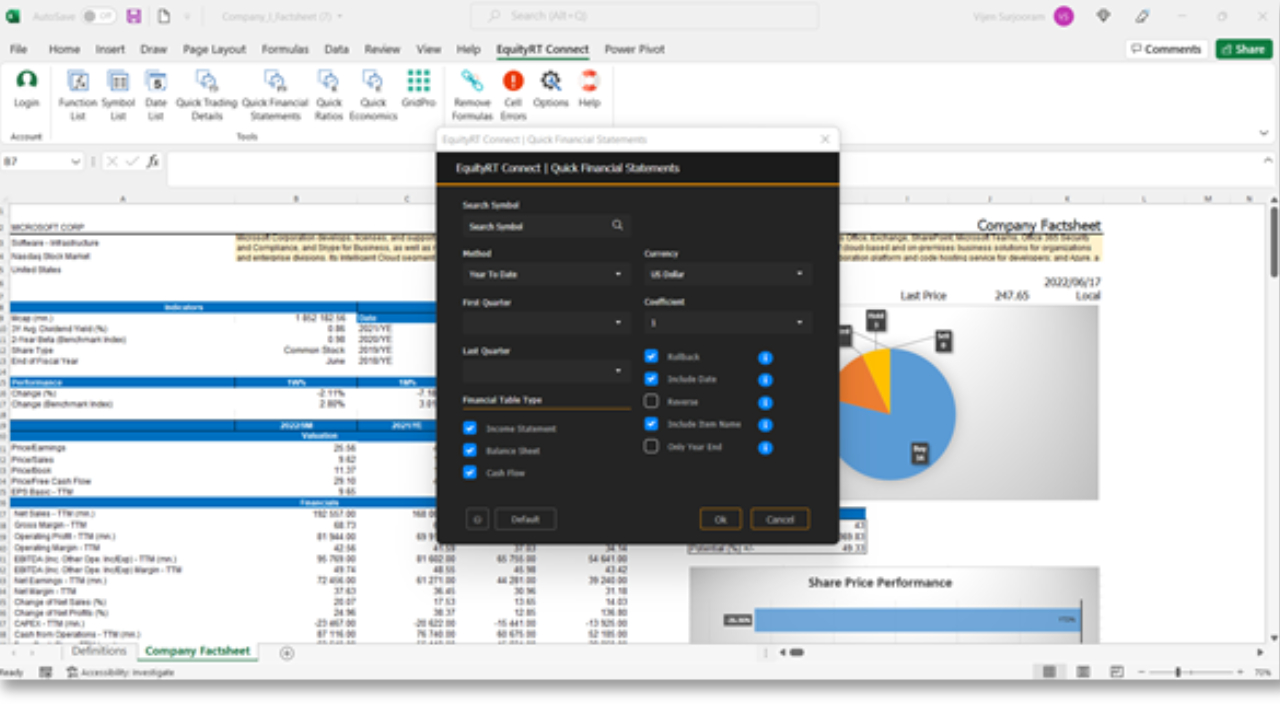
        Integrate with Excel

        Automate complicated and repetitive analytics in excel using our simple syntax. Use ready-built templates or get our team to help design your custom models.

        Insights and Data

        Insights you can count on

        Access comprehensive information and insights to support your research from the most reputable and trusted data providers.

        We won’t settle for any less and you shouldn’t either.

        122k

        Listed Companies

        130

        Stock Exchanges

        160

        News Source

        40k

        Economic Indicators

        Fundamental Analysis

        Rich depth in fundamental analysis including extended coverage in emerging markets. We also provide company financials in a pure as published format.

        Shareholder Analysis

        Smart analytics is applied on detailed shareholder data to reveal interesting trends in shareholder behavior and stock holding patterns.

        Estimates & Forecasts

        Comprehensive coverage of estimates, forecasts and recommendations from analysts.

        Stock Screening and Sector Analytics

        Save time and improve your efficiency with our advanced stock screening and sector analysis tools.

        Fixed Income

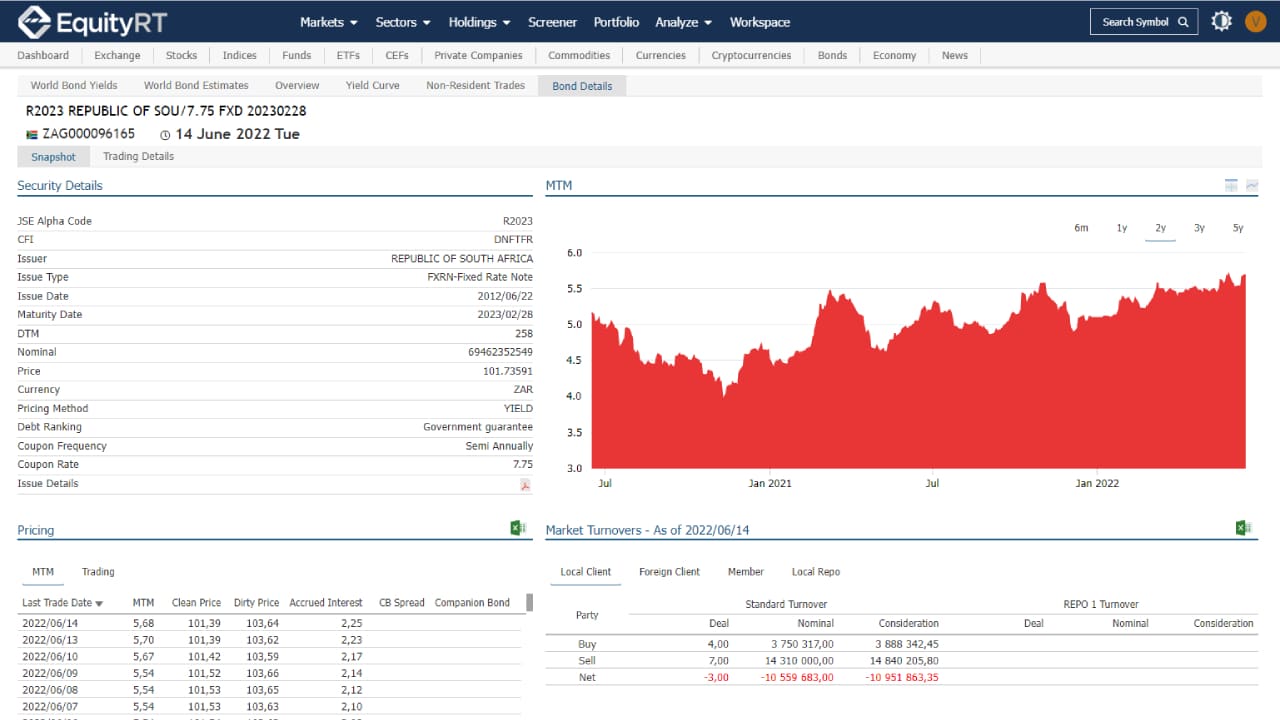
        In-depth fixed income data is sorted and arranged in visually appealing screens making it easy to navigate to the information you need.

        Macro Economic

        Boost your research with access to economic indicators from 200 countries. A wide coverage with easily accessible information makes EquityRT the go-to option for detailed economic analysis.
        Free Trial

        Request a 14 Day Free Trial

        The best way to understand what makes EquityRT different is to try it for yourself.
        A member of our team will get in touch with you to learn more about your needs and clarify how we can assist.

        Let the journey begin!

        Get in touch

        HEADQUARTERS

        United States

        +1 917 267 8595

        OUR COMPANY

        About Us

        Who Do We Help

        Global Footprint

        In The News

        Market Watch

        SOLUTIONS

        Stock Market Data Analysis
        Specialized Data Solutions

        INDUSTRIES

        Investment Management

        Financial Advisory & Wealth Management

        Economic Research & Academia

        Investor Relations & Corporates

        Consulting & Advisory Services

        CONTACT US

        Connect With Us


        • Follow
        • Follow
        • Follow
        • Follow
        • Follow
        Get in touch

        Copyright © EquityRT | Privacy Policy | Disclaimer | Terms of Service