CPI and PCE: Two Indicators of Inflation in the U.S.
Inflation can be defined as a persistent increase in the overall level of prices of goods and services that households typically purchase. When the prices rise over time the cost of living becomes more expensive. Prices can also fall – this situation is called deflation. Deflation causes delays in purchases and lending money.
Nobody loves inflation but it is not entirely a bad thing. Yes, it hurts everyone’s standard of living but despite that, a modest, stable and predictable amount of inflation is necessary for a healthy economy.
From stock market to mortgage rates, consumer spending to business investment, inflation plays a major role for all aspects of the economy.
All the information you need in one place. Add EquityRT to your toolkit for quality investment research.
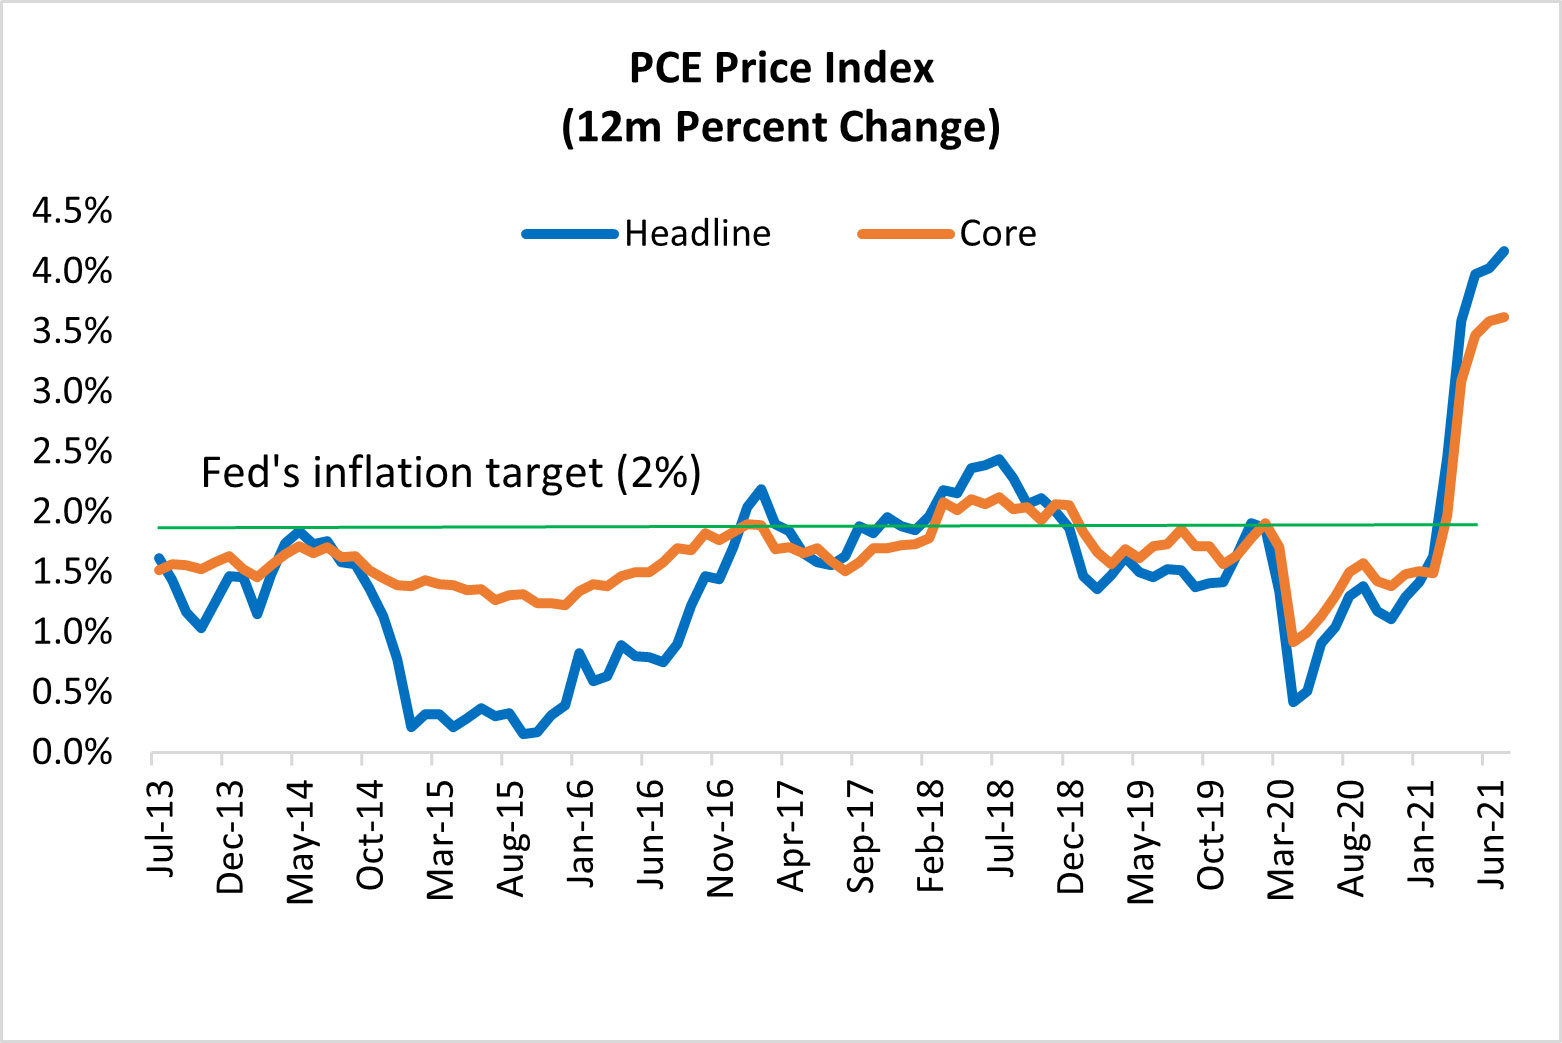
In July 2021, the Personal consumption expenditures (PCE) Index rose 4.2% year-on-year, and core PCE rose 3.6%.
Reading these lines, one could think why there are different inflation measures?
Consumer Price Index (CPI) and Producer Price Index (PPI)
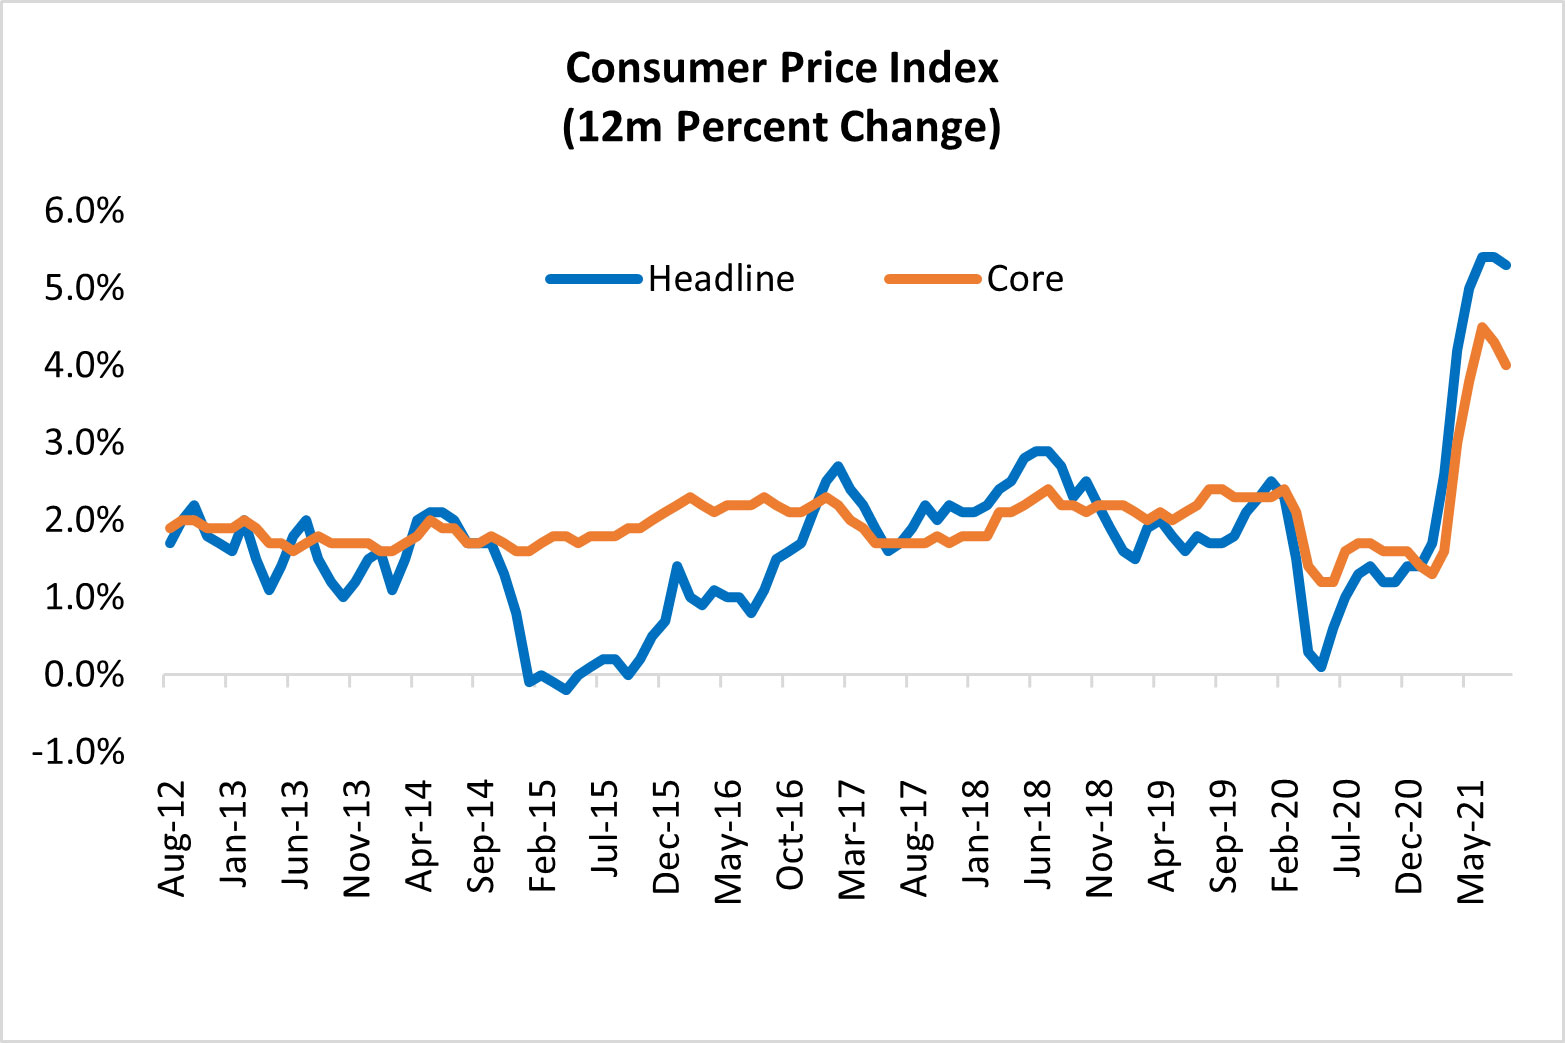
The best-known measure of inflation is the consumer price index – also referred to as the CPI. It is a weighted average of a fixed basket of items (goods and services) that are consumed by households. The percentage change in the CPI provides a sound measure of the consumer inflation in an economy.
Core CPI strips out food and energy, where prices tend to fluctuate wildly. Core measure gives a better sense of underlying trends in prices that affect the cost of living. Naturally, we can not omit food and energy from our monthly out-of-pocket expenses but the high volatility of these two components often obscures the underlying trend.
Both the headline CPI and the core inflation are important but their audiences are different. The CPI helps households see their overall cost of living over a time period while the core inflation is used by government policymakers to gauge the state of the economy. In the end, policymakers seek to stabilize overall consumer prices.
The CPI is not the only measure that economists watch to evaluate inflation: The producer price index (PPI) measures inflation from the perspective of domestic producers. The cost of producing food, consumer goods and commodity prices directly affect the retail pricing which makes the PPI a leading indicator of consumer inflation.
The following chart shows the year-on-year percentage change in CPI and PPI from August 2018 through August 2021.
In August 2021, the producer prices (PPI) rose 8.3% year-on-year while consumer prices (CPI) rose 5.3%. The PPI is rising faster than the CPI suggesting that higher consumer prices are inevitable.
Personal Consumption Expenditures Price Index
The U.S. Federal Reserve policymakers judge changes in inflation by monitoring different types of price indices. The Fed often emphasizes the personal consumption expenditure (PCE) as a price inflation measure because the PCE price index covers the broadest range of non-market prices of households and non-profits spending.
Additionally, the expenditure weights in the PCE can change, as buyers switch away from more expensive goods and services into cheaper substitutes. For example, if the price of meat goes up, people buy less meat and the PCE uses a new basket of goods that takes this change into account.
As the chart below indicates, PCE is less volatile than CPI. In the context of the Federal Reserve’s dual mandate (price stability and full employment), it is not surprising that the Federal Reserve’s inflation metric has been the core PCE.
A Note to Blog Readers
These charts are auto-updated via EquityRT Excel Add-in, shortly after the data comes out.
You can contact us to request the charts in Excel. We also send a free copy of Excel spreadsheet covering different types of prices indices including, core consumer prices, CPI trimmed mean, food inflation, export prices, CPI housing utilities etc.
Contact us to learn more about our services: info@equityrt.com
Source: National sources via EquityRT MacroAnalytics
Report by Özge Gürses | Macro Research at EquityRT


