Global Stock Market Highlights
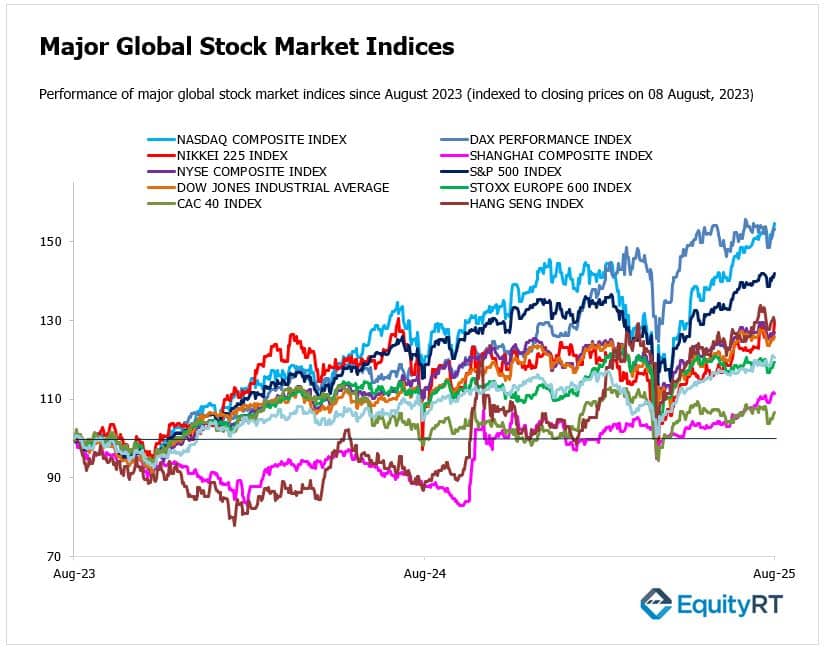
Wall Street indexes closed higher on Friday, led by technology stocks, as optimism over a potential ceasefire between Russia and Ukraine grew ahead of a planned meeting between Trump and Putin this week. The Nasdaq hit a fresh record, the S&P 500 hovered near record highs, and all major indices posted solid weekly gains:
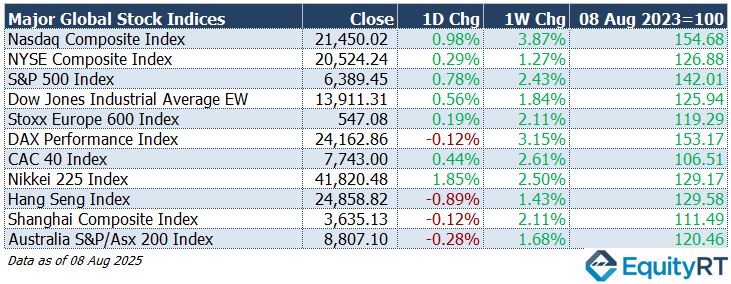
- Nasdaq Composite Index closed at 21,450.02, up 0.98% on the day and up 3.87% for the week.
- NYSE Composite Index closed at 20,524.24, up 0.29% on the day and up 1.27% for the week.
- S&P 500 Index closed at 6,389.45, up 0.78% on the day and up 2.43% for the week.
- Dow Jones Industrial Average EW closed at 13,911.31, up 0.56% on the day and up 1.84% for the week.
European markets also closed the week on a high note: modest daily gains combined with stronger earnings and dovish central bank expectations helped produce the best weekly performance in three months. Financials and healthcare led the rally, while Germany’s DAX remained under pressure:
- Stoxx Europe 600 Index closed at 547.08, up 0.19% on the day and up 2.11% for the week.
- DAX Performance Index closed at 24,162.86, down 0.12% on the day but up 3.15% for the week.
- CAC 40 Index closed at 7,743.00, up 0.44% on the day and up 2.61% for the week.
In the Asia-Pacific region, outlook was cautiously optimistic as trade policy shifts and tech sector strength supported gains in Japan, while other markets faced pressure from continued tariff uncertainty and global market volatility:
- Nikkei 225 Index closed at 41,820.48, up 1.85% on the day and up 2.50% for the week.
- Hang Seng Index closed at 24,858.82, down 0.89% on the day but up 1.43% for the week.
- Shanghai Composite Index closed at 3,635.13, down 0.12% on the day but up 2.11% for the week.
- Australia S&P/ASX 200 Index closed at 8,807.10, down 0.28% on the day but up 1.68% for the week.
** Japanese markets were closed today for a public holiday.
- The Dollar Index (DXY), a closely watched gauge of the U.S. dollar’s performance against other major currencies, rose to 98.26, gaining 0.24% on the day, but down 0.44% for the week and 9.40% year-to-date.
- The Brent crude oil, the global oil price benchmark, fell to $66.11 per barrel, declining 0.48% on the day, 5.11% for the week, and 11.43% year-to-date.
- The Gold rose to $3,397.28 per ounce, increasing 0.06% on the day, 1.02% for the week, and 29.45% year-to-date.
- The 2-year U.S. Treasury yield particularly responsive to Federal Reserve policy rates, climbed to 3.77%, rising 3.30 basis points on the day, 7.10 basis points for the week, but down 48.30 basis points year-to-date.
- The 10-year U.S. Treasury yield, an indicator of long-term borrowing costs, rose to 4.29%, increasing 2.70 basis points on the day, 6.10 basis points for the week, and down 29.00 basis points year-to-date.

Take the Guesswork out of Investing: Backtest Your Strategies with Ease!
Upcoming U.S. Economic Indicators to Watch This Week
In the US, focus will be on July’s CPI report for signs of the impact from new tariffs. Headline inflation is expected to quicken to 2.8%, the highest in five months, while core CPI is seen rising to 3%, also a five-month peak.
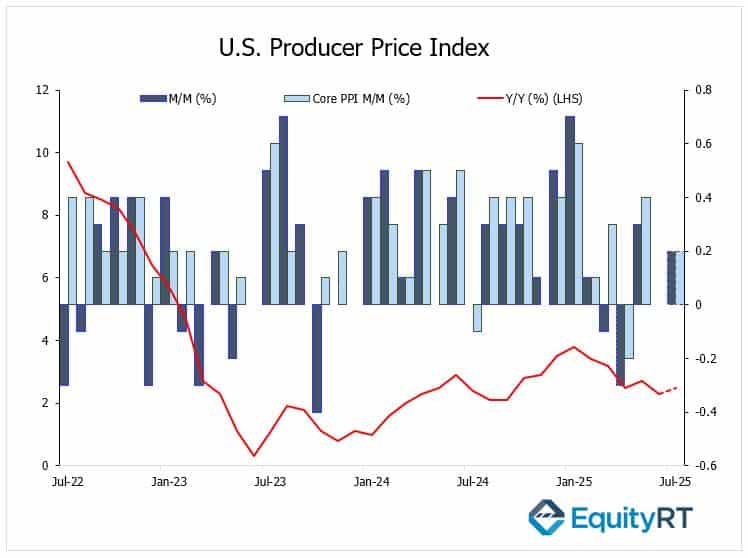
Producer price figures will be released on Thursday, Analysts anticipate a 0.2% month-over-month increase in both the headline and core PPI, following a flat reading in June. This marks a rebound from the 0.5% decline observed in April.
The U.S. Producer Price Index (PPI) for June 2025 showed no change compared to May. This came after a 0.3% rise in May and a 0.3% drop in April. Year-over-year, PPI increased 2.3% in June, down from 2.7% in May, the smallest yearly gain since September 2024.
The PPI measures the average change over time in the selling prices received by domestic producers for their output. The core PPI excludes food and energy prices to provide a clearer view of underlying inflation trends. An increase in the PPI suggests rising production costs, which can signal potential inflationary pressures in the broader economy.
Market participants will be closely monitoring this data to assess inflationary trends and to gauge the potential impact on Federal Reserve policy decisions.
Retail sales are projected to grow 0.5%, slightly slower than June’s unexpectedly strong 0.6% gain, while industrial production is expected to contract 0.2%.
The University of Michigan’s consumer sentiment index is forecast to improve. The final reading of the University of Michigan Consumer Sentiment Index for July was revised slightly downward from 61.8 to 61.7, coming in below expectations. However, it still showed an improvement compared to June’s level of 60.7. The month-on-month increase in consumer sentiment was largely driven by consumers’ more positive views on short-term business conditions.
Additional releases include import and export prices, the monthly budget statement, NFIB Business Optimism Index, NY Empire State Manufacturing Index, and business inventories.
Outside of data, markets will track the confirmation process for Stephen Miran as the newest FOMC member and remarks from several Fed officials.
The Q2 earnings season winds down with results from Cisco, Applied Materials, Deere & Company, and major Chinese ADRs.
In Canada, investors await the Bank of Canada’s Summary of Deliberations. Brazil will post inflation and retail sales data, while Mexico will release new industrial production figures.
Unleash Your Investment Potential. EquityRT might be the missing puzzle piece to reach your ultimate investment strategy.
Upcoming Economic Indicators in Europe to Watch This Week
In the UK, this week will be dominated by a busy slate of economic releases, with attention on the latest jobs report and second-quarter GDP figures, accompanied by June’s monthly data, manufacturing output, and the trade balance. The unemployment rate is expected to remain at 4.7%, it’s highest since July 2021, while wage growth is seen easing to 4.7%, marking a nine-month low.
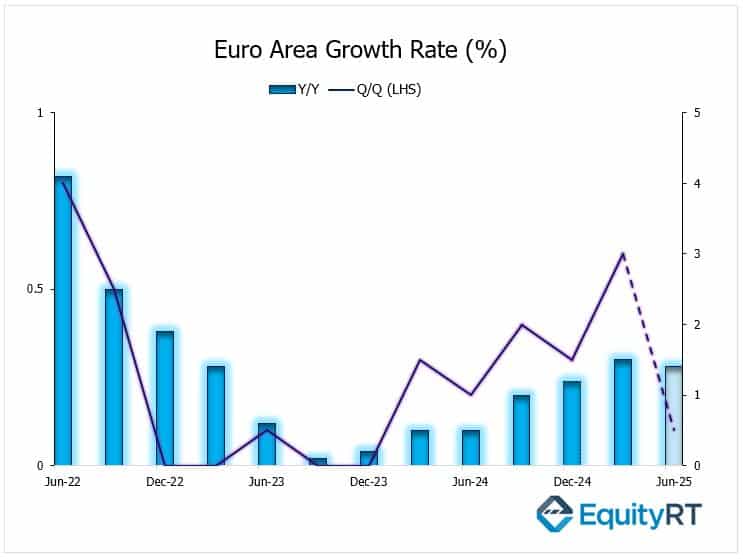
The second estimate of Euro Area GDP growth is forecast to expand by 0.2% in June, translating into a modest 0.1% increase for the quarter. The latest data for the Euro Area’s GDP growth in the second quarter of 2025 shows a year-on-year increase of 1.4%, which is a slight decrease compared to the 1.5% growth in the first quarter but still better than the expected 1.2%. On a quarter-on-quarter basis, the economy grew by only 0.1%, slowing down from the 0.6% growth in Q1. This slowdown partly reflects the effect of U.S. companies frontloading imports before new tariffs were imposed.
Despite the slower quarter-on-quarter growth, the Euro Area’s economy performed better than many had anticipated, indicating some resilience in the face of global trade tensions and uncertainties.
Across Europe, the German ZEW economic sentiment index is projected to retreat sharply from its highest level since February 2022, while wholesale prices are anticipated to rise for a second consecutive month.
Industrial production in the Euro Area likely declined in June following May’s rebound, and the bloc will release its second estimate of Q2 GDP. Switzerland, Poland, and Russia are all set to publish initial GDP readings, while final inflation data will be released for several major economies.
Elsewhere, Italy’s trade balance, and Russia’s inflation figures are due. On the policy front, Norway’s Norges Bank is widely expected to keep interest rates steady at 4.25% after delivering its first rate cut in five years at its previous meeting.
Take the Guesswork out of Investing: Backtest Your Strategies with Ease!
Upcoming Economic Indicators in Asia- Pacific to Watch This Week
China will be closely monitored this week, with a fresh round of monthly data expected to shed light on the economy’s momentum. Retail sales and fixed asset investment are likely to remain steady at 4.8% and 2.8%, respectively. Lending figures are also anticipated to reveal a slowdown in new loan issuance.
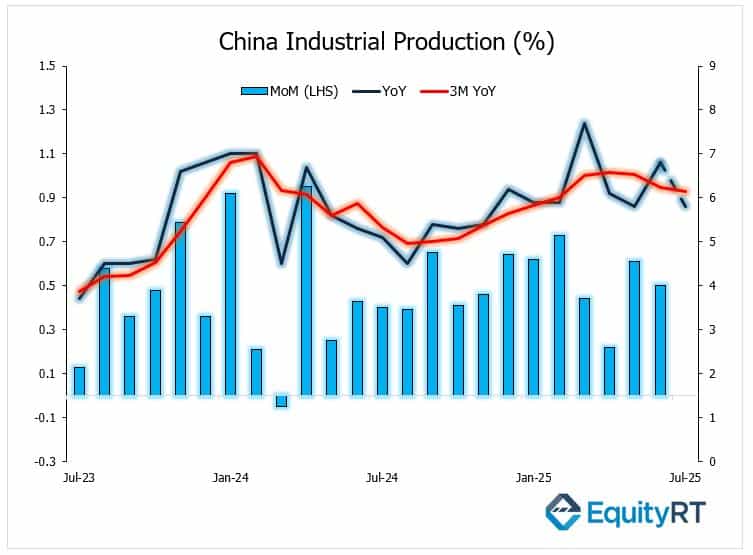
China’s industrial production data for July 2025 is scheduled to be released on Friday.
In June 2025, China’s industrial production grew 6.8% year-on-year, accelerating from May’s 5.8% and beating expectations. Manufacturing and mining both saw notable gains, while utilities grew more slowly. Most major manufacturing sectors expanded, with strong performances in automotive, tech, and heavy industries. Monthly output rose 0.5%, and industrial production increased 6.4% in the first half of the year, reflecting steady industrial recovery supported by government stimulus efforts.
Given the PMI’s contraction and ongoing challenges in export demand and global trade, it’s reasonable to anticipate that July’s industrial production growth will be slightly lower than June’s figure, projected to ease from 6.8% to 5.8%.
In Japan, preliminary second-quarter GDP data is expected to show a modest 0.1% quarter-on-quarter expansion, marking a slight rebound from the flat growth recorded in the first quarter. Additional releases will include the Reuters Tankan survey, the producer price index, and machine tool orders.
In Australia, the Reserve Bank is widely expected to cut the cash rate by 25 basis points to 3.6%, responding to weakening domestic demand and a rising unemployment rate. The week’s economic highlights will feature the NAB Business Confidence survey, housing loan data, and a series of labor market indicators.
Elsewhere in the region, the Bank of Thailand is forecast to lower its policy rate by 25 basis points to 1.5%, while Singapore, Malaysia, and Hong Kong will release their final GDP readings for the second quarter.
