Global Stock Market Highlights
On Friday, U.S. stock markets experienced declines, influenced by concerns over inflation and tariff-related costs, particularly affecting technology and manufacturing sectors. Technology sector faced pressure due to declines in major AI-related stocks. Healthcare and consumer staples sectors showed resilience, with gains of 0.73% and 0.64%, respectively.
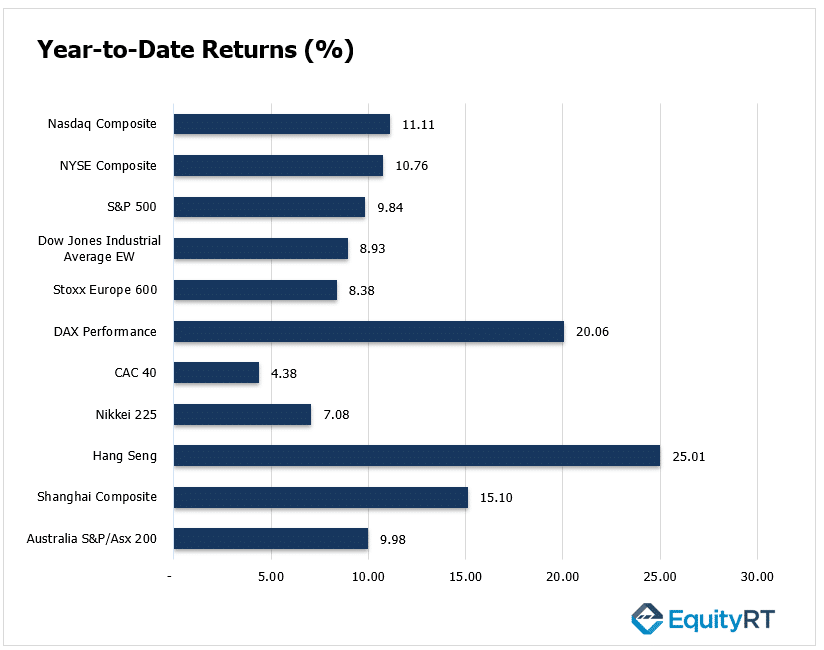
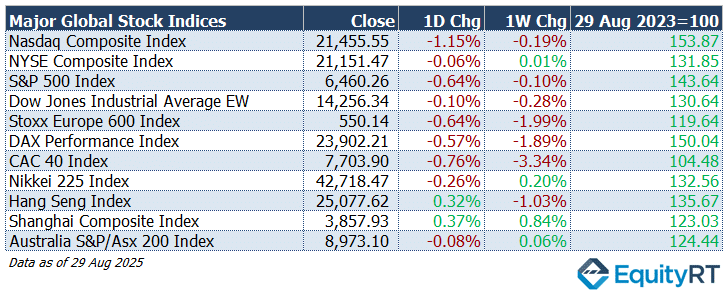
- Nasdaq Composite Index closed at 21,455.55, down 1.15% on the day and 0.19% lower for the week.
- NYSE Composite Index closed at 21,151.47, down 0.06% on the day but up 0.01% for the week.
- S&P 500 Index closed at 6,460.26, down 0.64% on the day and 0.10% lower for the week.
- Dow Jones Industrial Average EW closed at 14,256.34, down 0.10% on the day and 0.28% lower for the week.
**U.S. markets will be closed on Monday due to Labor Day.
European stock markets experienced declines, influenced by geopolitical tensions and concerns over central bank independence.
- Stoxx Europe 600 Index closed at 550.14, down 0.64% on the day and 1.99% lower for the week.
- DAX Performance Index closed at 23,902.21, down 0.57% on the day and 1.89% lower for the week.
- CAC 40 Index closed at 7,703.90, down 0.76% on the day and 3.34% lower for the week.
Asian stock markets exhibited a mixed performance, influenced by various regional factors, including political unrest in Indonesia, investor caution ahead of key U.S. economic data, and market holidays in certain countries.
- Nikkei 225 Index closed at 42,718.47, down 0.26% on the day but up 0.20% for the week.
- Hang Seng Index closed at 25,077.62, up 0.32% on the day but down 1.03% for the week.
- Shanghai Composite Index closed at 3,857.93, up 0.37% on the day and 0.84% higher for the week.
- Australia S&P/ASX 200 Index closed at 8,973.10, down 0.08% on the day but up 0.06% for the week.
Stock Market Snapshot: Year-to-Date Performance Review
Global stock markets have shown mostly positive results in 2025, though with some differences across regions:
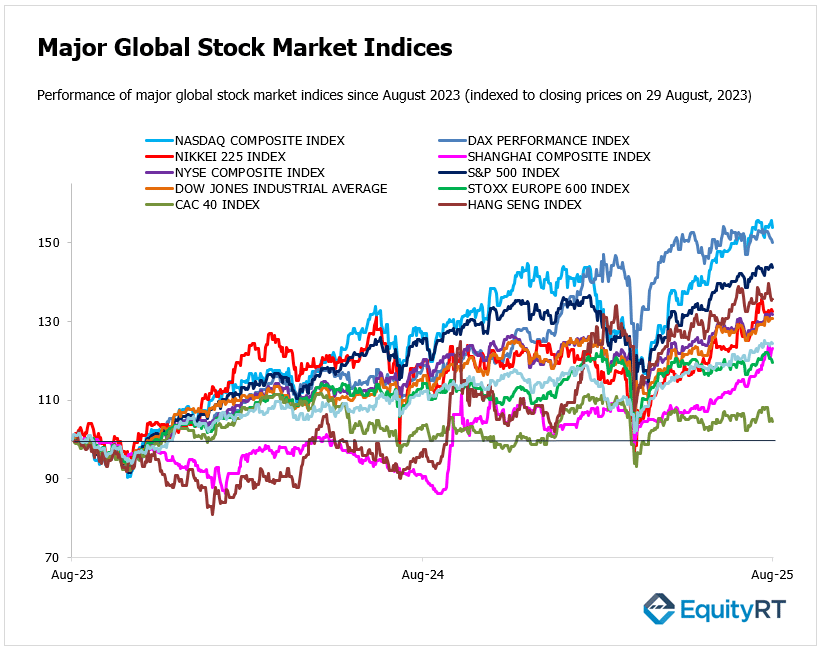
Hang Seng Index led with a strong 25% gain, reflecting renewed confidence in Asian markets. DAX Index followed with a 20% rise, supported by industrial and technology strength. Shanghai Composite Index also performed well, up 15.1%.
On the weaker side, CAC 40 Index gained only 4.4%, highlighting slower momentum compared to its peers in Europe.
In the U.S., returns were steady. The Nasdaq Index (11.1%) and NYSE Composite Index (10.8%) delivered double-digit growth, while the S&P 500 Index (9.8%) and Dow Jones EW Index (8.9%) also rose.
Australia’s ASX 200 Index climbed 10%, in line with global averages.
Asia and Germany outperformed, U.S. and Australian markets remained steady while France lagged.
Market Snapshot: Dollar, Gold, Oil & U.S. Yields Update

- The Dollar Index (DXY) eased to 97.85, down 0.04% on the day, up 0.12% over the week, and lower by 9.77% year-to-date.
- Brent crude slipped to $67.45 per barrel, losing 0.78% on the day, 0.41% on the week, and 9.63% since the start of the year.
- Gold advanced to $3,448.50 per ounce, gaining 0.91% daily, 2.23% weekly, and 31.40% year-to-date.
- Silver climbed to $39.74 per ounce, rising 1.69% today, 2.16% this week, and 37.61% YTD.
- In fixed income, the U.S. 2-year Treasury yield eased to 3.63%, down 1.20 bps on the day, 8.40 bps on the week, and 62.70 bps year-to-date, while the 10-year yield edged up to 4.23%, gaining 2.40 bps daily, slipping 3.10 bps weekly, and down 34.30 bps so far this year.
Take the Guesswork out of Investing: Backtest Your Strategies with Ease!
Upcoming U.S. Economic Indicators to Watch This Week
In the U.S., attention will centre on the August jobs report, the final labor release before the Fed’s September rate decision, following last month’s sharp downward revisions.
FOMC members have voiced concerns about a cooling labor market, with consensus expectations pointing to 75,000 non-farm payrolls being added. The unemployment rate is seen rising to a near four-year high of 4.3%, while wage growth is forecast to hold steady at 0.3%.
Keynote: U.S. Jobs Market
Investors are closely monitoring the upcoming U.S. jobs report for August, scheduled for release this Friday.
The report is anticipated to provide crucial insights into the labor market’s health and influence the Federal Reserve’s monetary policy decisions.
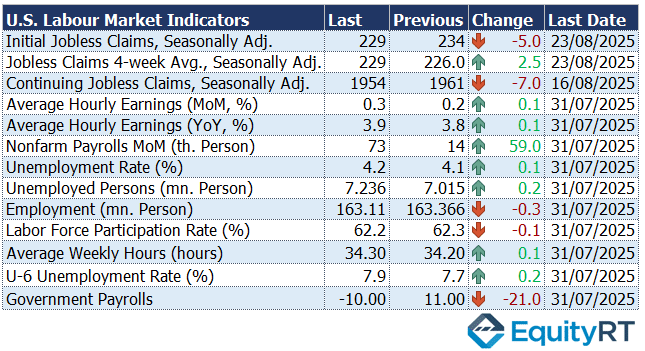
Economists forecast the addition of approximately 75,000 jobs in August, a slight increase from July’s 73,000.
The unemployment rate is expected to rise to 4.3% from 4.2% in July. This uptick may reflect a cooling labor market, with fewer job openings and a slight increase in layoffs.
Average hourly earnings are projected to increase by 0.3% month-over-month, maintaining a year-over-year growth rate of around 3.7%. While this suggests steady wage inflation, it may not significantly impact the Federal Reserve’s inflation targets.
The ADP employment report will also be in focus, alongside the JOLTS survey, amid growing scrutiny of official labor data.
Key indicators due include the ISM PMIs, expected to show ongoing contraction in manufacturing but expansion in services, and the trade balance, which remains sensitive to tariff impacts.
The Federal Reserve will release its Beige Book, compiled from assessments by its 12 regional banks. The report will provide updated evaluations of the U.S. economy and insights into expectations for the coming period.
On earnings, results from Broadcom and Salesforce will provide further insight into the tech sector.
In Canada, investors will watch labor market and trade data, as well as the S&P Global and Ivey PMIs. In Brazil, a busy week will feature the release of Q2 GDP, followed by PMIs, trade, and industrial production figures.
Unleash Your Investment Potential. EquityRT might be the missing puzzle piece to reach your ultimate investment strategy.
Upcoming Economic Indicators in Europe to Watch This Week
The Euro Area will see inflation data after country-level releases showed mixed results: France, Spain, and Italy undershot forecasts at 0.8%, 2.7%, and 1.7%, respectively, while German inflation exceeded expectations at above 2%.
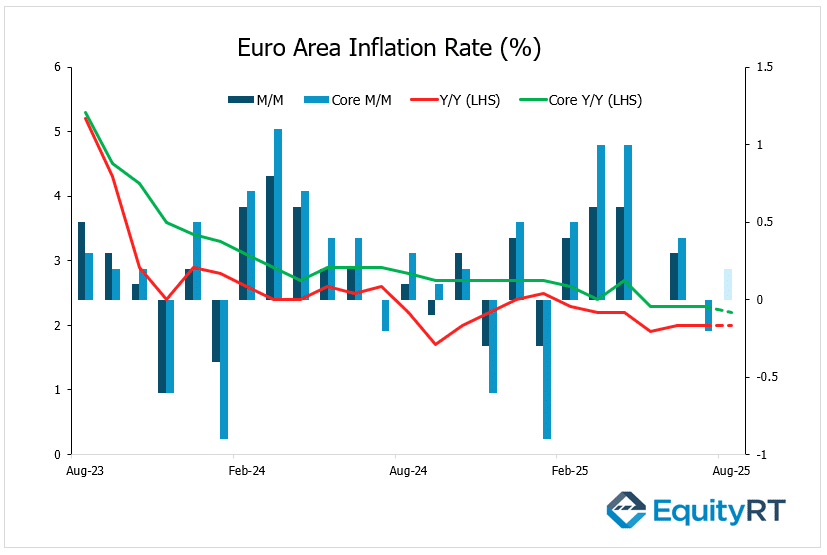
In Germany, factory orders are projected to rebound after two months of declines. Other key releases include Euro Area and Italian retail sales, as well as unemployment figures for the Euro Area, Italy, and Spain.
Spain and Italy PMIs are expected to align with broader global trends, showing modest improvement in manufacturing and slower growth in services.
On Friday, the Euro Area’s final GDP growth figures for the second quarter will be released. Following a 0.6% quarter-on-quarter expansion in the first quarter, the region’s economy slowed sharply, posting only a modest 0.1% increase in the second quarter.
Other data include French trade, Swiss inflation, unemployment, and consumer sentiment.
The National Bank of Poland will also announce its interest rate decision.
In the United Kingdom, retail sales are expected to rise for a second month, after the ONS delayed the release for further quality checks. Additional UK data will cover mortgage approvals and both Nationwide and Halifax house price indexes.
Take the Guesswork out of Investing: Backtest Your Strategies with Ease!
Upcoming Economic Indicators in Asia- Pacific to Watch This Week
In China, the manufacturing PMI climbed to 50.5 in August 2025, surpassing both July’s figure and the market forecast of 49.5, and reached its strongest level since March.
Beijing recently announced measures to support consumer loans and introduced capacity cuts to aid business margins.
In the second quarter of 2025, capital expenditure by Japanese firms on plants and equipment rose 7.6%, up from 6.4% in the prior quarter and above market expectations of 6.2%. Additional data releases cover the leading and coincident indexes, as well as wage growth figures.
In Australia, Q2 GDP is expected to rise 0.5%, alongside a full week of releases including July trade data, building permits, private house approvals, the current account, the Ai Group Industry Index, and household spending.
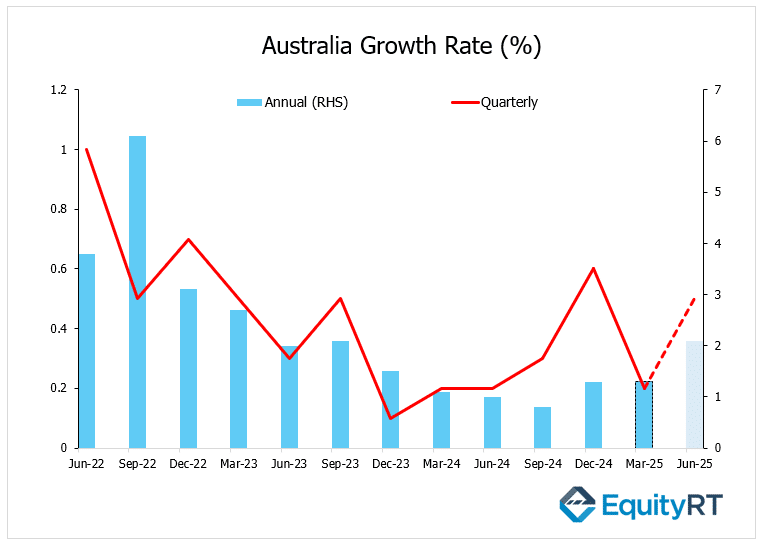
Elsewhere, South Korea will publish Q2 GDP and trade figures, while Malaysia’s central bank sets monetary policy. Additional trade data will come from South Korea, Indonesia, Thailand, and Vietnam, with inflation updates due from South Korea, Indonesia, the Philippines, Vietnam, and Taiwan. Manufacturing PMIs across the region will also be closely tracked.
