Global Stock Market Highlights
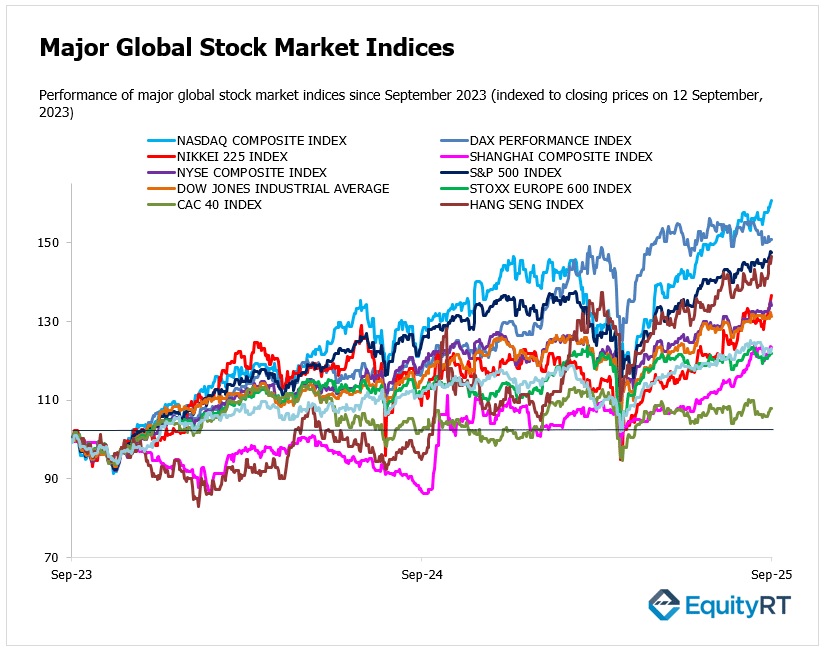
Last week, markets had their best week in about five weeks. U.S. market sentiment was positive, largely built on expectations that the Federal Reserve will begin cutting interest rates next week. Nasdaq benefitted from strong performance in technology and growth stocks, pushing it to record highs:
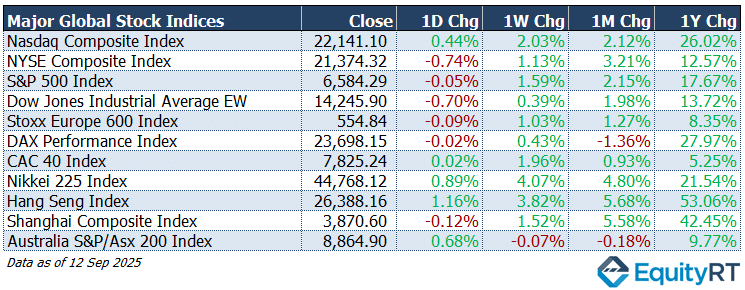
- Nasdaq Composite Index closed at 22,141.10, up 0.44% on the day, 2.03% higher for the week and 2.12% higher over the month.
- NYSE Composite Index closed at 21,374.32, down 0.74% on the day, 1.13% higher for the week and 3.21% higher over the month.
- S&P 500 Index closed at 6,584.29, down 0.05% on the day, 1.59% higher for the week and 2.15% higher over the month.
- Dow Jones Industrial Average EW closed at 14,245.90, down 0.70% on the day, 0.39% higher for the week and 1.98% higher over the month.
European stock markets ended Friday on a softer note:
- Stoxx Europe 600 Index closed at 554.84, down 0.09% on the day, 1.03% higher for the week and 1.27% higher over the month.
- DAX Performance Index closed at 23,698.15, down 0.02% on the day, 0.43% higher for the week but 1.36% lower over the month.
- CAC 40 Index closed at 7,825.24, up 0.02% on the day, 1.96% higher for the week and 0.93% higher over the month.
Stocks across Asia rode a wave of optimism, supported by expectations that the U.S. Federal Reserve will begin cutting interest rates, plus strong momentum in tech and AI-related sectors. Australia’s ASX also gained, though less dramatically, trending upward in line with regional positive sentiment
- Nikkei 225 Index closed at 44,768.12, up 0.89% on the day, 4.07% higher for the week and 4.80% higher over the month.
- Hang Seng Index closed at 26,388.16, up 1.16% on the day, 3.82% higher for the week and 5.68% higher over the month.
- Shanghai Composite Index closed at 3,870.60, down 0.12% on the day, 1.52% higher for the week and 5.58% higher over the month.
- Australia S&P/ASX 200 Index closed at 8,864.90, up 0.68% on the day, 0.07% lower for the week and 0.18% lower over the month.
Stock Market Snapshot: Year-to-Date Performance Review
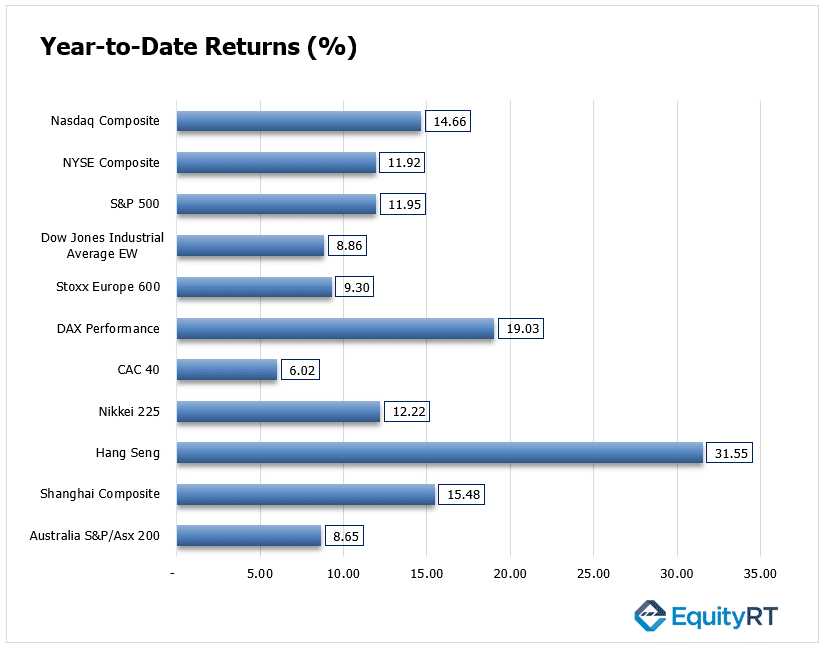
The standout performer is the Hang Seng Index, posting an impressive 31.55% year-to-date, far ahead of its global peers. This strong rebound reflects renewed optimism around Chinese equities and investor confidence in policy support.
The DAX Performance Index also shows notable strength with 19.03%, making it one of the top-performing developed market indices, driven by resilience in the German economy and industrials.
Among US benchmarks, the Nasdaq Composite (14.66%) leads, boosted by continued momentum in technology and growth stocks, while the S&P 500 (11.95%) and NYSE Composite (11.92%) show healthy double-digit gains. The Dow Jones EW (8.86%) trails slightly, reflecting its broader weighting.
In Asia, Nikkei 225 (12.22%) remains solid, supported by a weaker yen and strong corporate earnings, while the Shanghai Composite (15.48%) has also outperformed, showing a robust recovery.
On the weaker side, CAC 40 (6.02%) and Australia’s S&P/ASX 200 (8.65%) lag behind other indices, reflecting more subdued investor sentiment in those regions.
Market Snapshot: Dollar, Gold, Oil & U.S. Yields Update
- The US Dollar Index (DXY) closed at 97.61, up 0.10% on the day, down 0.13% over the week, 0.44% lower on the month, and 10.00% lower year-to-date.
- Brent Crude Oil closed at $66.91 per barrel, up 1.02% on the day, 2.16% higher over the week, 1.20% higher on the month, and 2.16% higher year-to-date.
- Gold closed at $3,642.37 per ounce, up 0.29% on the day, 1.39% higher over the week, 8.79% higher on the month, and 38.79% higher year-to-date.
- Silver closed at $42.16 per ounce, up 1.54% on the day, 2.93% higher over the week, 11.21% higher on the month, and 45.99% higher year-to-date.
- The 2-Year U.S. Treasury yield closed at 3.56%, up 1.00 basis point on the day, 4.30 bps higher over the week, 17.90 bps lower on the month, and 69.00 bps lower year-to-date.
- The 10-Year U.S. Treasury yield closed at 4.07%, up 4.00 basis points on the day, 0.70 bps lower over the week, 22.40 bps lower on the month, and 50.60 bps lower year-to-date.

Take the Guesswork out of Investing: Backtest Your Strategies with Ease!
Upcoming U.S. Economic Indicators to Watch This Week
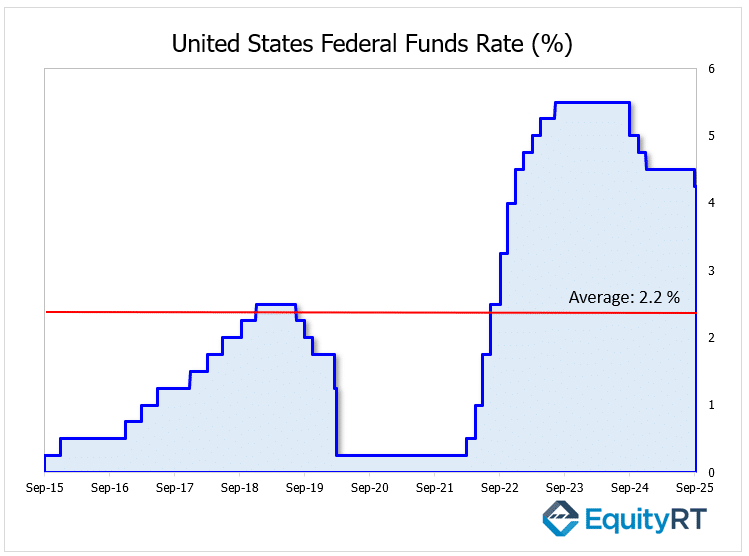
This week, investors are closely watching the Fed’s upcoming policy rate decision, updated macroeconomic projections, and Chair Powell’s press conference, all of which are scheduled for Wednesday.
Markets largely expect a 25-bps cut in the fed funds rate to 4.00%–4.25%, though some anticipate a larger 50-bps reduction.
According to the Fed’s latest macroeconomic projections released in June, a total 50-bps rate cut is expected in 2025, the 50-bps cut forecast for 2026 was revised down to 25 bps, and a 25-bps rate cut is projected for 2027.
A cut could boost U.S. equities, particularly interest-rate-sensitive sectors like technology and consumer discretionary, while a smaller or more cautious reduction may temper market optimism.
Recent data highlight a faster-than-expected cooling in the labor market, though tariff-related price pressures have yet to significantly affect inflation. On the data front, retail sales for August are expected to rise 0.3%, extending a three-month streak of gains, while industrial production has likely stalled, pointing to slowing manufacturing activity that could weigh on investor sentiment.
Other important U.S. economic releases this week include trade prices, housing starts and permits, business inventories, the NAHB housing index, net TIC flows, and regional manufacturing surveys from New York and Philadelphia. These data releases will provide further insights into economic momentum and guide sector-specific performance in equities.
Global developments will also be in focus. The Bank of Canada is expected to cut rates by 25-bps, reflecting weakness in jobs, investment, and income growth, which could weaken the Canadian dollar and support U.S. exporters.
In contrast, Brazil is likely to keep borrowing costs unchanged after a 450-bps tightening cycle that began in September 2024, signaling stable conditions in emerging markets.
Key data from Canada (inflation, retail sales, housing starts) and Brazil (unemployment), along with Argentina’s GDP, could further shape investor sentiment and capital flows into U.S. markets.
Unleash Your Investment Potential. EquityRT might be the missing puzzle piece to reach your ultimate investment strategy.
Europe’s Economic Calendar: Must-Watch Indicators Shaping Markets This Week
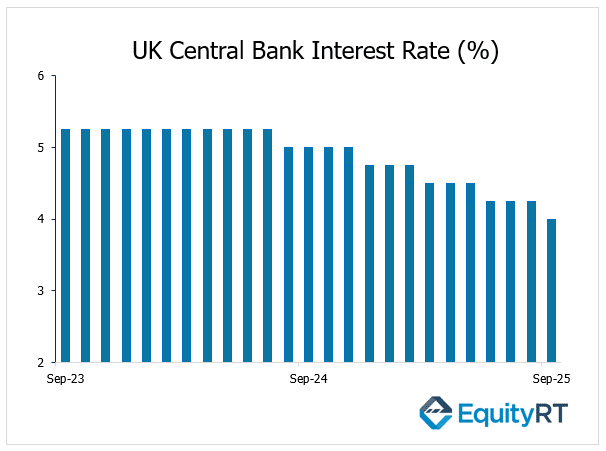
In the UK, markets are focused on the Bank of England’s policy decision, with interest rates expected to remain steady after last month’s cut. August inflation is projected to rise to 3.9%, the highest since January 2024, while unemployment is seen holding at 4.7%, its peak since mid-2021. Retail sales are forecast to post a third consecutive gain, offering some relief amid sluggish growth.
In Germany, the ZEW sentiment index is set to decline for a second month, highlighting fragile business confidence, while producer prices may record their sharpest drop since May 2024. Across the euro area, industrial output is expected to rebound, and final CPI data should confirm inflation at 2.1%. In France, the manufacturing climate index is likely to slip to an 11-month low.
Markets will also watch Norway’s Norges Bank policy decision, along with key data releases from Germany, Italy, Switzerland, and the broader Euro Area which could influence regional market sentiment and capital flows.
Market volatility may be expected in Europe this week as investors react to central bank decisions, inflation data, and industrial output. Sectors tied to manufacturing, exports, and consumer demand will likely be most sensitive.
Take the Guesswork out of Investing: Backtest Your Strategies with Ease!
Asia-Pacific Economic Updates: Critical Indicators Investors Should Follow This Week
Ahead of this week, China released a wave of key economic data. Chinese production and consumption showed the weakest performance of the year, signalling that the economy may be experiencing a broad-based slowdown. Retail sales, an indicator of private consumption, rose by 3.4% year-on-year, compared to a 3.8% expected increase. Fixed-asset investment grew by 0.5%, versus a 1.5% forecast. Industrial production increased by 5.2% year-on-year, below the expected 5.6% growth.
On the policy front, Vice Premier He Lifeng will meet a U.S. delegation in Spain to discuss trade and tariffs, adding geopolitical weight to market sentiment.
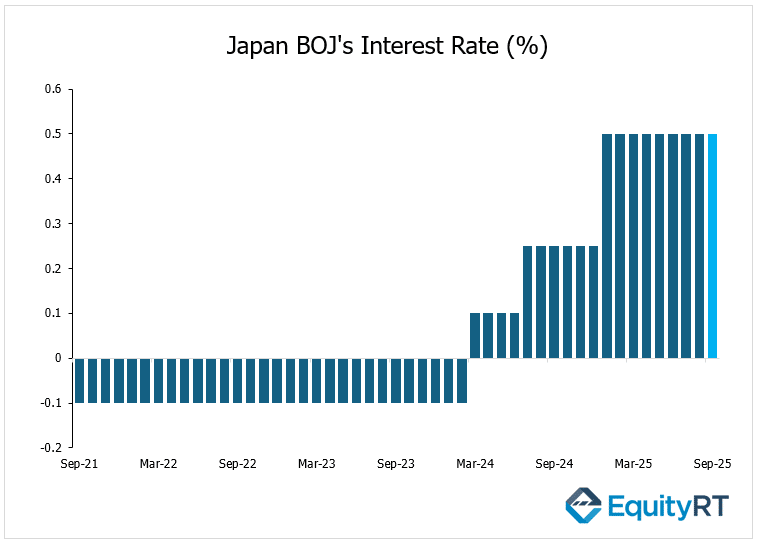
In Japan, the Bank of Japan is likely to keep rates unchanged at 0.5%, amid domestic uncertainty and a soft global trade environment. Trade data may show continued weakness in exports and imports, while core CPI is forecast to ease to 2.7%, its lowest since November 2024.
India’s wholesale prices rose 0.52% year-on-year in August 2025, exceeding market expectations of a 0.30% increase and rebounding from July’s 0.58% decline, the steepest drop since July 2023. Meanwhile, the country’s merchandise trade deficit narrowed slightly to $26.49 billion in August 2025, down from $29.7 billion during the same month last year.
Australia will release August labor market figures, while Indonesia and Taiwan announce policy decisions, and New Zealand publishes Q2 GDP and trade data.
Increased volatility may be observed in Asia-Pacific markets this week as investors react to China’s growth indicators, BoJ policy, and regional economic data. Trade-sensitive sectors, exporters, and financial markets will be particularly responsive.
