Global Stock Market Highlights
On Friday, U.S. stock markets ended the week slightly lower after a volatile session shaped by weaker-than-expected jobs data and shifting expectations for Federal Reserve policy. Markets had touched record intraday highs earlier in the day as investors bet on an imminent rate cut, but sentiment cooled as labor market weakness raised concerns about the broader economic outlook.
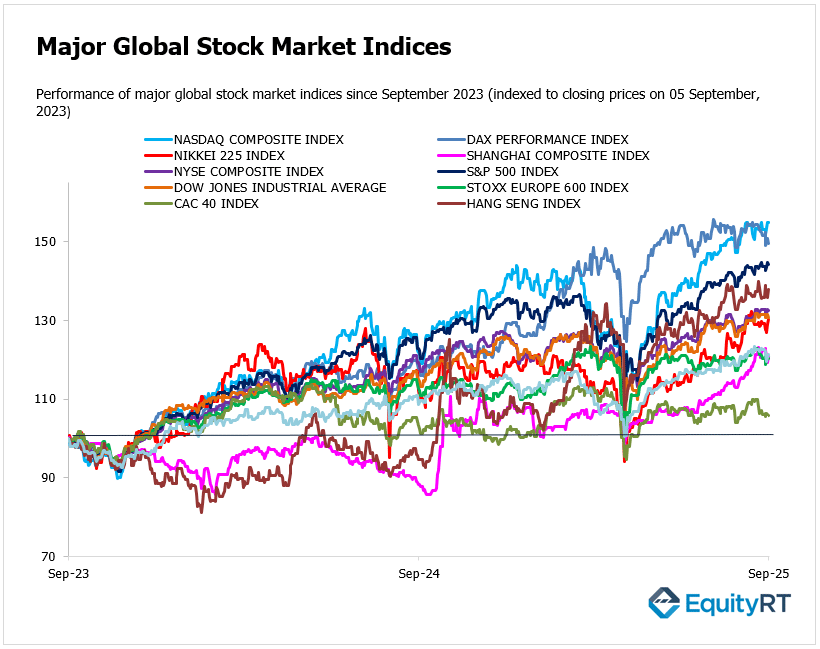
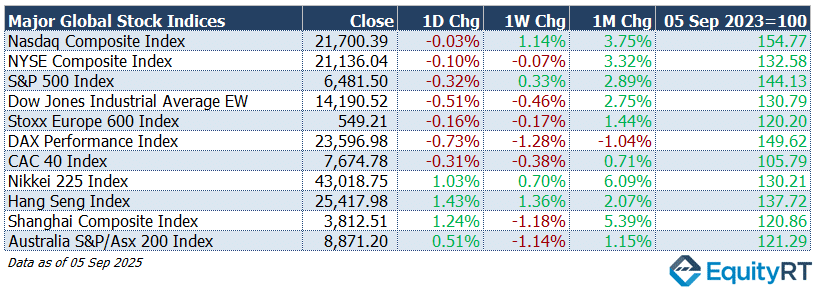
- Nasdaq Composite Index closed at 21,700.39, down 0.03% on the day, up 1.14% for the week and 3.75% higher over the month.
- NYSE Composite Index closed at 21,136.04, down 0.10% on the day, 0.07% lower for the week but 3.32% higher over the month.
- S&P 500 Index closed at 6,481.50, down 0.32% on the day, up 0.33% for the week and 2.89% higher over the month.
- Dow Jones Industrial Average EW closed at 14,190.52, down 0.51% on the day, 0.46% lower for the week but 2.75% higher over the month.
European equity markets delivered a mixed performance, initial strength, supported by industrial, banking, and tech sector gains, gave way to caution as investors digested U.S. labor market signals and domestic developments.
- Stoxx Europe 600 Index closed at 549.21, down 0.16% on the day, 0.17% lower for the week and 1.44% higher over the month.
- DAX Performance Index closed at 23,596.98, down 0.73% on the day, 1.28% lower for the week and 1.04% lower over the month.
- CAC 40 Index closed at 7,674.78, down 0.31% on the day, 0.38% lower for the week but 0.71% higher over the month.
Most Asia-Pacific markets closed higher last Friday, led by equity gains across Japan, Hong Kong, China, and Australia, spurred by rate cut hopes and falling yields.
- Nikkei 225 Index closed at 43,018.75, up 1.03% on the day, 0.70% higher for the week and 6.09% higher over the month.
- Hang Seng Index closed at 25,417.98, up 1.43% on the day, 1.36% higher for the week and 2.07% higher over the month.
- Shanghai Composite Index closed at 3,812.51, up 1.24% on the day, 1.18% lower for the week but 5.39% higher over the month.
- Australia S&P/ASX 200 Index closed at 8,871.20, up 0.51% on the day, 1.14% lower for the week but 1.15% higher over the month.
Stock Market Snapshot: Year-to-Date Performance Review
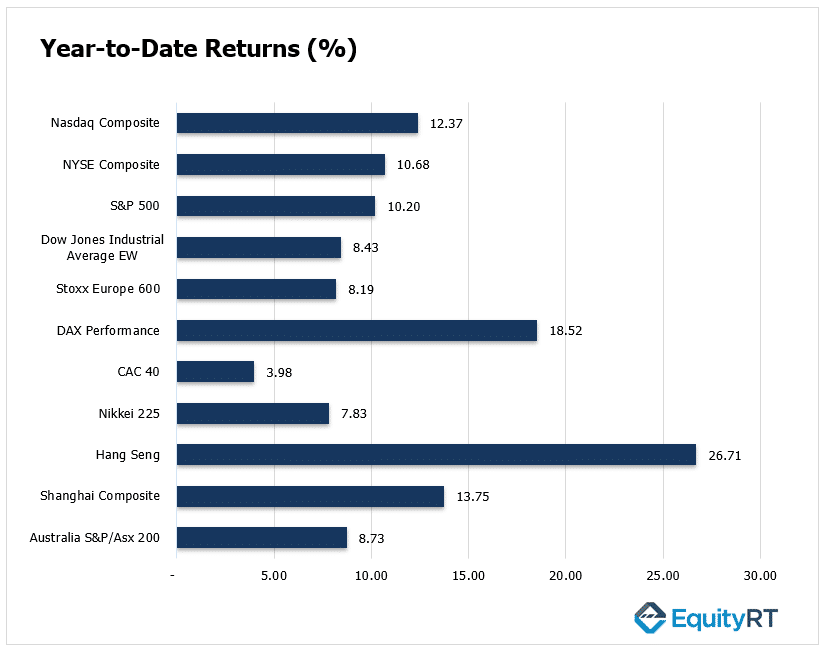
Global equity markets showed mixed performances so far this year. The Hang Seng Index led with a strong 26.7% gain, followed by Germany’s DAX at 18.5% and the Shanghai Composite at 13.8%.
In the U.S., the Nasdaq Composite advanced 12.4%, ahead of the NYSE Composite (10.7%) and S&P 500 (10.2%). More moderate gains were seen in the Dow Jones EW (8.4%), Stoxx Europe 600 (8.2%), Australia’s S&P/ASX 200 (8.7%) and Japan’s Nikkei 225 (7.8%). The CAC 40 trailed with a modest 4.0% rise.
Market Snapshot: Dollar, Gold, Oil & U.S. Yields Update

- The Dollar Index (DXY) eased to 97.74, down 0.56% on the day, 0.11% lower over the week, 1.03% lower on the month, and down 9.88% year-to-date.
- Brent Crude Oil fell to $65.58 per barrel, down 2.10% on the day, 2.82% lower over the week, 3.05% lower on the month, and 2.82% lower year-to-date.
- Gold rose to $3,592.50 per ounce, up 1.28% on the day, 4.15% higher over the week, 6.25% higher on the month, and up 36.89% year-to-date.
- Silver gained to $40.96 per ounce, up 0.71% on the day, 3.15% higher over the week, 8.30% higher on the month, and up 41.83% year-to-date.
- The 2-Year U.S. Treasury yield declined to 3.52%, down 7.90 basis points on the day, 10.60 bps lower over the week, 22.00 bps lower on the month, and 73.30 bps lower year-to-date.
- The 10-Year U.S. Treasury yield fell to 4.08%, down 8.50 basis points on the day, 15.60 bps lower over the week, 14.10 bps lower on the month, and 49.90 bps lower year-to-date.
Take the Guesswork out of Investing: Backtest Your Strategies with Ease!
Upcoming U.S. Economic Indicators to Watch This Week
In the United States, attention will turn to August’s inflation figures, with headline CPI expected to climb to 2.9%, the highest since January, while core inflation is set to remain above 3%.
Producer prices are projected to rise 0.3% from the prior month, and benchmark revisions to nonfarm payrolls will be closely watched after a series of downbeat labor reports.
Keynote: Producer Price Index
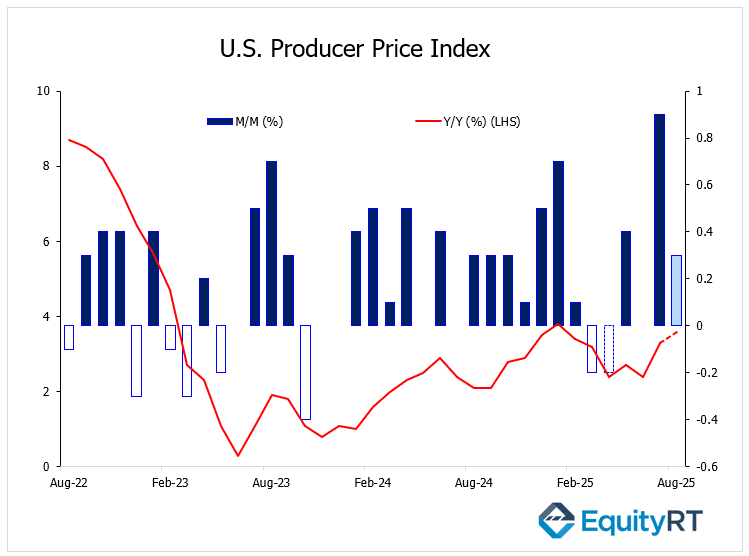
The U.S. Producer Price Index (PPI) for August 2025 is set to be released on Wednesday, drawing close attention from markets as it will offer fresh insights into inflation trends and shape expectations for Federal Reserve monetary policy.
In July 2025, the PPI recorded a notable 0.9% month-over-month increase, the largest since May 2022, and a 3.3% rise year-over-year, surpassing the expected 0.2% monthly gain. This jump was largely driven by higher service costs.
For August, analysts are forecasting a 0.3% month-over-month increase, representing a moderate recovery following July’s surprise surge. On a year-over-year basis, the consensus expects a 3.6% rise, slightly above July’s outcome.
Core PPI is anticipated to continue trending upward, signaling persistent inflationary pressures. A figure above expectations could heighten concerns about sustained inflation and influence the Fed’s policy decisions.
The University of Michigan’s consumer sentiment survey will provide further clues on household confidence and inflation expectations, while additional data includes the NFIB small business optimism index, NY Fed inflation expectations, and the monthly budget statement.
Elsewhere in the region, Canada will report manufacturing sales and Mexico its inflation numbers.
Unleash Your Investment Potential. EquityRT might be the missing puzzle piece to reach your ultimate investment strategy.
Upcoming Economic Indicators in Europe to Watch This Week
In Europe, focus shifts to the ECB, which is expected to leave rates unchanged for a second straight meeting, keeping the deposit rate at 2%.
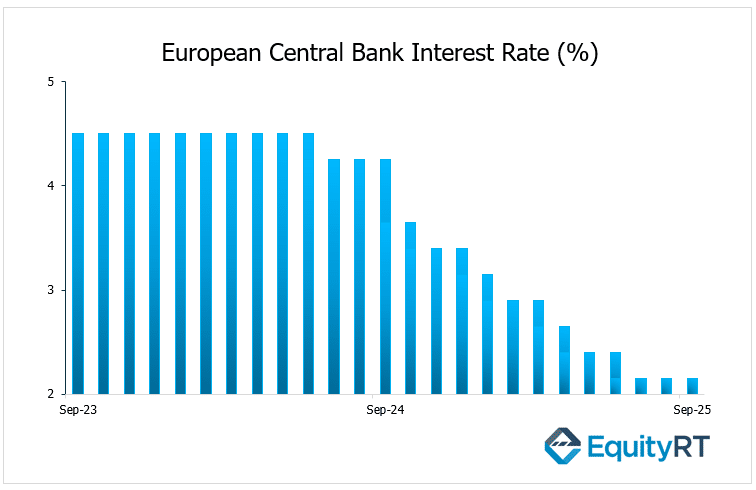
Updated macroeconomic projections will be released, offering fresh insight into the policy path ahead. Final inflation readings are due across several countries, including Germany, France, and Spain, while Norway heads into parliamentary elections.
Germany’s industrial production climbed 1.3% month-over-month in July 2025, rebounding from a revised 0.1% drop in June and matching market expectations. The gain was led by strong output in machinery and equipment (9.5%), the automotive sector (2.3%), and pharmaceuticals (8.4%).
Take the Guesswork out of Investing: Backtest Your Strategies with Ease!
Upcoming Economic Indicators in Asia- Pacific to Watch This Week
In Asia-Pacific, markets focused on China’s trade figures, with exports climbing 4.4% year-on-year to USD 321.8 billion in August 2025. The result fell short of the anticipated 5% increase and slowed from July’s 7.2% gain, marking the weakest pace since February. The moderation was attributed to softer demand from China’s largest consumer market and a temporary easing of tariff pressures.
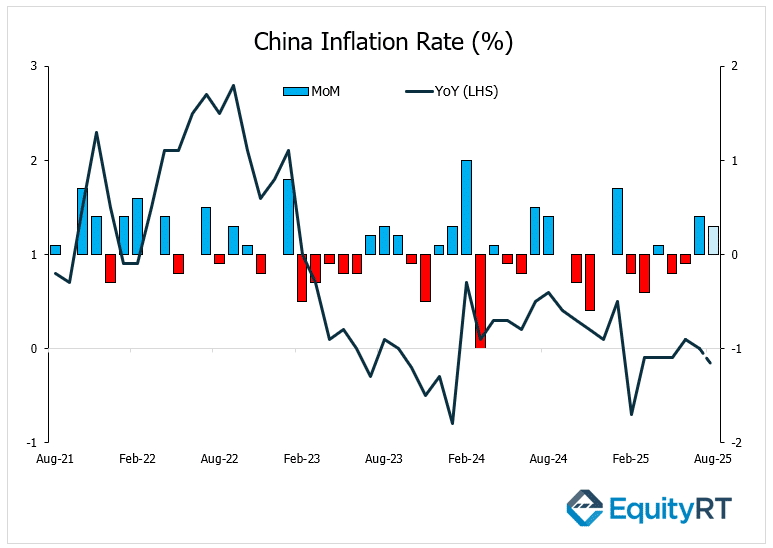
Chinese CPI is forecast to fall 0.2% and PPI by 2.9%. Additional updates include vehicle sales and new yuan loans, coinciding with the National People’s Congress Standing Committee session.
Japan’s economy grew 0.5% quarter-on-quarter in Q2 2025, surpassing the preliminary estimate of 0.3% and accelerating from a revised 0.1% expansion in Q1. This marked the fifth consecutive quarter of growth, supported mainly by stronger private consumption, which was revised up to 0.4% from 0.2% in the flash estimate after showing no growth in the previous quarter.
India is set to release August inflation and reserve data, while Australia publishes consumer and business confidence, inflation expectations, and finalized housing approvals.
Elsewhere, Taiwan will update trade statistics, and both South Korea and Singapore will release labor market data.
