One big challenge in financial analysis is gathering the right data from many sources and using it to figure out how much a company’s stock is worth. There are different ways to do this, but the main goal is to see if a company’s finances are getting better or worse. The whole point of this is to make smart predictions, invest in stocks wisely, and hopefully make some money by owning a piece of these companies and sharing in their profits.
- The Vital Role of Financial Analysts and Stock Screeners
Financial analysts not only need to understand a company’s complex finances but also have the important job of sharing information about these companies in a clear and honest way. The stock market is all about being clear and accurate. While each country has its own rules for sharing financial information, companies compete to share as much data as possible in a way that’s easy to understand. So, no matter how good a company is at what they do, they might struggle to get investors interested unless they can show off their achievements really well.
To do this, many businesses try to turn raw data into useful insights. They create presentations for investors that back up their investment potential with reliable sources, so people can trust that they’re in good shape financially. Their goal is to make it clear to the investment community how well they’re doing.
When financial analysts take all the big piles of data that companies spill out and turn it into things like ratios and other useful numbers, it’s not just making the information bigger; it’s making it more valuable. Investors dive deep into a company’s current, past, and future data to figure out if it’s a good idea to invest in them. This is where it gets tricky because they have to pick and choose the data that matches what they’re looking for from all this data overload. This part is a big deal in deciding whether to invest or not.
Thanks to the relentless advancement of technology, handling tons of data and picking out the stuff you want has become pretty doable. Take EquityRT’s Stock Screener, for example. It’s a handy tool that lets you sift through a bunch of data to find companies that match what you’re looking for financially. You can set all kinds of preferences, like picking specific criteria, choosing where the companies are located, what industry they’re in, and how big they are. It gives you lots of options, like different numbers, financial info, and even future predictions. This tool makes a task that might seem really hard at first super easy, doing it all in just a few seconds. So, you can search for companies without breaking a sweat.
All the information you need in one place. Add EquityRT in your toolkit for quality investment research.
- Customizing Investment Filters with EquityRT’s Stock Screener
If you want to find stocks that used to be really high but have gone down since then, you should have a strategy that focuses on this goal. One way to do it is by setting a filter that looks at how close the current stock price is to its highest ever price. This way, you can aim to catch stocks that have dropped from their peak and might be a good deal now.

However, if the primary goal is to identify dividend-paying companies, particularly those with high dividend yield efficiency, criteria should be selected accordingly.
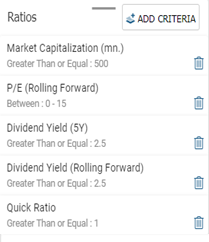
Let’s continue with an example of a dividend paid companies, which is a company notable for its dividend distribution. By utilizing criteria such as Market Capitalization, P/E Ratio, Dividend Yield (5Y), Dividend Yield (Rolling Forward), and Liquidity Ratio, you can easily filter companies that stand out in terms of dividend yield.

For each selected criterion, there is an option to set a “range” or show “all”. This enables you to review criteria such as dividend distribution within your desired range and assess factors like high/low market capitalization. Through this process, you can effectively identify the most suitable investment instrument tailored to your needs.
Below, you can see the results based on the criteria we have set within the “computer hardware and electronics sector”, categorized as “big and mid cap scale”, within the United Kingdom. The criteria are as follows:
Market Capitalization > 500, P/E Ratio between 0 and 15, Dividend Yield (5Y) > 2.5, Dividend Yield (Rolling Forward),> 2.5, and Liquidity Ratio > 1.

As a result, finding a company that meets our desired criteria within the sector we’re interested in from among the hundreds of companies trading on the London Stock Exchange has become achievable with just a few clicks.
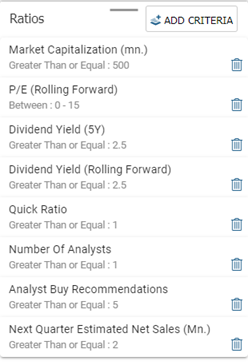
If you place importance on analysis and forecasts, you can expand your list of criteria by incorporating analysis predictions (forecast ranges) and buy-sell-hold recommendations.

Let’s expand the above example a bit and perform an additional filtering by including “analyst recommendations” as criteria for all sectors. In addition to all the above-mentioned criteria, with selections made for all sectors and market capitalization classifications, we want to compile a list by adding criteria such as Number of Analyst > 1, Analyst Buy Recommendations> 5, and Next Quarter Estimated Net Sales (Mn.) Next Year > 2. The results will then be sorted accordingly.
Our list now encompasses companies that not only distribute dividends but also receive buy recommendations from analysts and anticipate an increase in net sales.

With EquityRT’s Stock Screener, you don’t have to go through a million financial statements or spend forever collecting daily data and analyst recommendations one by one. Instead, you can quickly pick out the companies that match your criteria, making investment decisions faster and ditching all the tedious paperwork.
