Global Stock Market Highlights
On Friday, U.S. stock indexes closed lower as investors on Wall Street adopted a cautious stance amid Trump’s tariff threats. US President Trump announced that, starting August 1, products from the EU and Mexico will face an additional 30% tariff on top of sectoral duties:
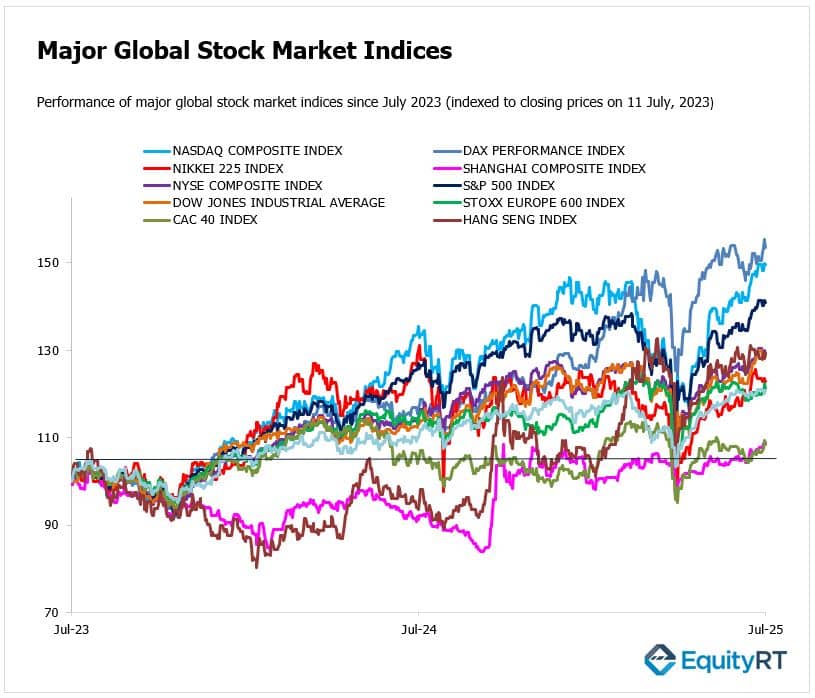
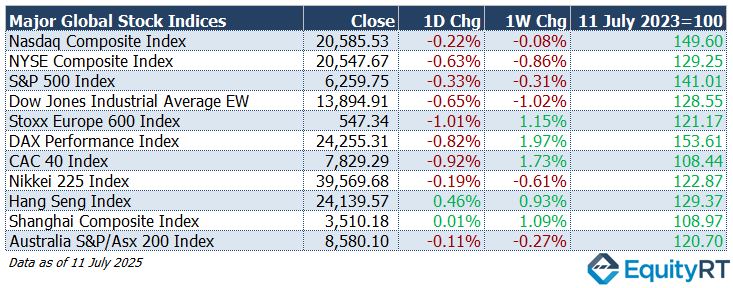
- Nasdaq Composite Index closed at 20,585.53, down 0.22% on the day and down 0.08% for the week.
- NYSE Composite Index closed at 20,547.67, down 0.63% on the day and down 0.86% for the week.
- S&P 500 Index closed at 6,259.75, down 0.33% on the day and down 0.31% for the week.
- Dow Jones Industrial Average EW closed at 13,894.91, down 0.65% on the day and down 1.02% for the week.
EU Commission President Von der Leyen said that they will continue negotiations with the U.S. regarding tariffs, but if no agreement is reached, they will take retaliatory measures. European stock markets experienced a notable decline, influenced by escalating trade tensions and economic concerns:
- Stoxx Europe 600 Index closed at 547.34, down 1.01% on the day but up 1.15% for the week.
- DAX Performance Index closed at 24,255.31, down 0.82% on the day but up 1.97% for the week.
- CAC 40 Index closed at 7,829.29, down 0.92% on the day but up 1.73% for the week.
Markets in China and Hong Kong exhibited optimism, supported by hopes for policy support and potential easing of trade disputes. Meanwhile, Japanese and Australian markets faced headwinds due to worries about export outlooks and global volatility.
- Nikkei 225 Index closed at 39,569.68, down 0.19% on the day and down 0.61% for the week.
- Hang Seng Index closed at 24,139.57, up 0.46% on the day and up 0.93% for the week.
- Shanghai Composite Index closed at 3,510.18, unchanged on the day and up 1.09% for the week.
- Australia S&P/ASX 200 Index closed at 8,580.10, down 0.11% on the day and down 0.27% for the week.
- The Dollar Index (DXY), a closely watched gauge of the U.S. dollar’s performance against other major currencies, rose to 97.87, up 0.28% on the day, 0.91% higher for the week, but down 9.76% year-to-date.
- The Brent crude oil, the global oil price benchmark, settled at $70.36 per barrel, gaining 2.51% daily, up 3.04% for the week, but still down 5.73% since the start of the year.
- The Gold climbed to $3,356.81 per ounce, rising 0.98% on the day, 0.65% for the week, and extending its year-to-date gain to 27.91%.
- The 2-year U.S. Treasury yield particularly responsive to Federal Reserve policy rates, edged up to 3.91 basis points, up 2.50 basis points on the day, 1.80 basis points higher for the week, but down 34.20 basis points so far this year.
- The 10-year U.S. Treasury yield, an indicator of long-term borrowing costs, rose to 4.41 basis points, gaining 6.10 basis points both on the day and for the week, while still showing a year-to-date decline of 16.40 basis points.

Take the Guesswork out of Investing: Backtest Your Strategies with Ease!
Upcoming U.S. Economic Indicators to Watch This Week
All eyes remain on President Trump’s expanding tariff plans, with new notices expected for the EU and other major trading partners. These developments could further cloud the global growth outlook and feed inflation worries.
The first packed week of Q2 earnings kicks off, led by major U.S. banks like JPMorgan, Bank of America, Goldman Sachs, and Citi. Markets will also watch big tech and industrial bellwethers, TSMC, ASML, Netflix, 3M, and J&J, for clues on consumer resilience, AI demand, and defensives performance.
On Tuesday, the June CPI report is expected to show headline inflation rising slightly faster, with the monthly rate up from 0.1% to 0.3% and the annual rate ticking up from 2.4% to 2.6%. Core CPI is also forecast to edge higher both monthly and annually.
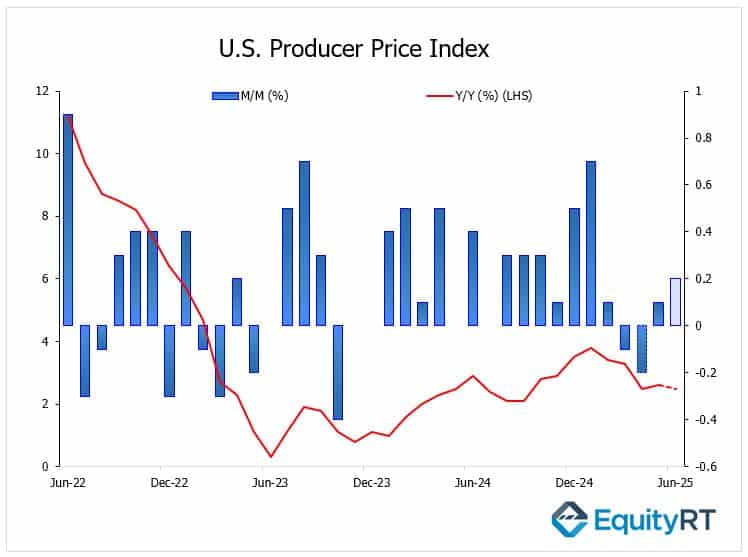
After the June CPI report on Tuesday, attention will turn to the U.S. June Producer Price Index (PPI), a key gauge of wholesale inflation pressures tomorrow. Markets expect the headline PPI to rise modestly month-on-month, picking up to 0.2% after May’s 0.1% increase, reflecting some price pass-through from recent tariff moves and higher input costs. However, the annual rate is expected to edge down slightly to 2.5% from May’s 2.6%, suggesting that pipeline inflation pressures remain contained for now.
The latest data indicates that while supply chain friction and tariffs may lift producer costs in the near term, the broader trend still supports the view that inflation is cooling gradually compared to last year’s peaks. Investors will watch for any signs that firms are passing higher costs onto consumers, a key point for the Fed’s next policy steps.
The June industrial production and capacity utilization figures will also be released, after recent prints showed weakness, especially in utilities output and overall capacity use, which fell to a six-month low in May. June is expected to show a slight recovery in output and a steady capacity rate.
Also on Wednesday, the Fed’s Beige Book will be published, giving fresh insight into the economic outlook across the 12 Fed districts.
The New York Fed Empire State Manufacturing Index will give an early read on July’s factory sentiment. The index dropped further into contraction in June but showed hints of a rebound in hiring and optimism; a partial improvement is expected for July.
On Thursday, retail sales will test the resilience of household demand. After sharp declines in April and May, driven partly by weaker vehicles and gasoline sales, a slight rebound is expected in June, with headline sales forecast to rise by 0.2% and core sales by 0.4%.
Weekly initial jobless claims will be watched for signs of labor market tightness after filings unexpectedly fell to a seven-week low last week, signaling continued strength in the jobs market.
On Friday, markets will also watch the preliminary reading of the University of Michigan Consumer Sentiment Index for July. The final figure for June was slightly revised up to 60.7 from the initial 60.5, marking a significant improvement from May’s level of 52.2.
Unleash Your Investment Potential. EquityRT might be the missing puzzle piece to reach your ultimate investment strategy.
European Economic Trends: This Week’s Macro Insights
On Tuesday, the Euro Area’s May industrial production will be watched for signs of recovery. After a strong 2.4% gain in March, output fell by the same margin in April, the sharpest monthly drop since July 2023. May is expected to show a modest rebound with a 0.6% monthly increase.
Also on Tuesday, Germany’s July ZEW Economic Sentiment and Current Conditions Indexes will be released.
On Wednesday, the UK’s June CPI will provide new clues for the Bank of England. In May, monthly inflation slowed sharply from 1.2% to 0.2%, the weakest pace in four months, mainly due to a drop in housing-related costs, communication services, and transport. Year-on-year, headline CPI eased slightly to 3.4% from April’s 3.5% high, while core inflation also slowed but remained well above the BoE’s 2% target.
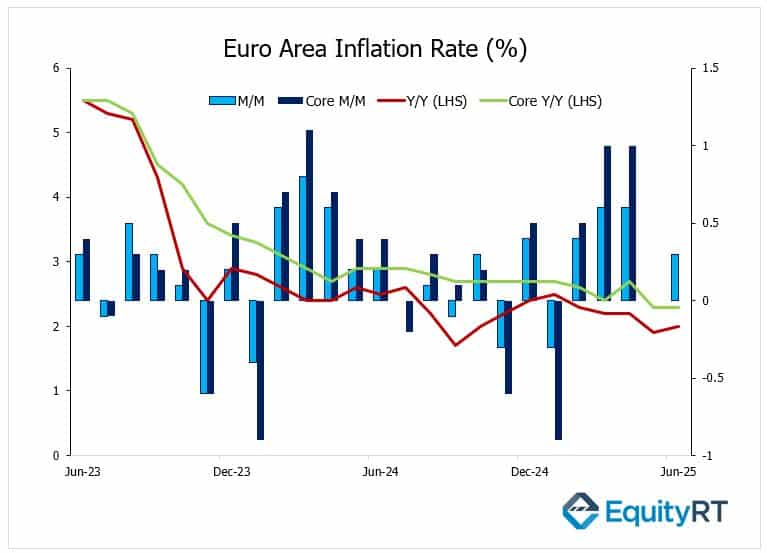
On Thursday, the Euro Area’s final June CPI will confirm whether inflation is staying on target and offer fresh insight into the European Central Bank’s next steps. Flash estimates showed headline inflation rising from 0% to 0.3% month-on-month and edging up to 2% year-on-year, in line with the ECB’s goal and marking the highest level since January.
Core inflation held steady at 2.3%, its lowest since 2022 but still above target. The uptick was mainly driven by firmer services prices and a slower decline in energy costs, while moderate wage gains and currency trends continue to support the region’s disinflation path.
Investors expect the final reading to confirm the flash estimate, but any upward revision could keep the ECB cautious about further rate cuts in the coming months.
Take the Guesswork out of Investing: Backtest Your Strategies with Ease!
Asian Economic Data: This Week’s Outlook
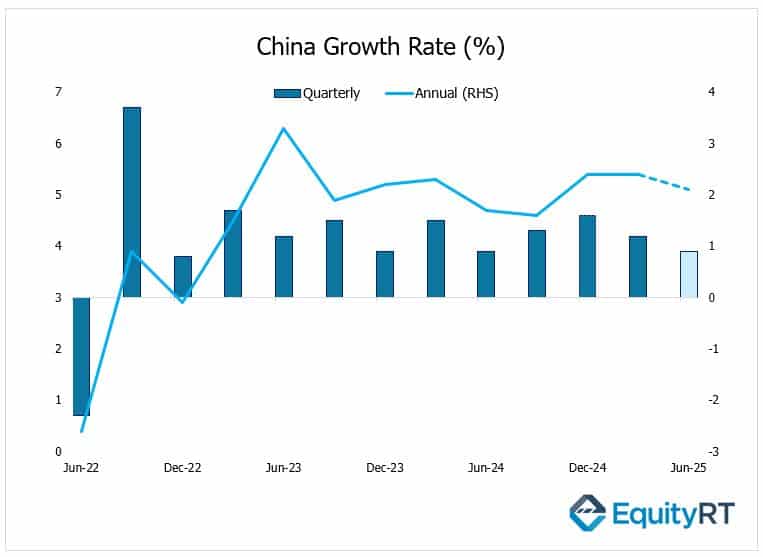
In Asia, all eyes will be on China’s Q2 GDP growth figures due tomorrow. In Q1, China’s economy grew by 1.2% quarter-on-quarter, slowing from 1.6% — its weakest pace since Q2 2024. However, annual growth came in at 5.4%, beating expectations (5.2%) and marking the strongest rate in 1.5 years, thanks to extensive monetary and fiscal stimulus that helped offset the negative impact of the U.S. tariffs and retaliatory measures.
Beijing’s main priority this year remains boosting domestic consumption to cushion trade headwinds. For Q2, the economy is expected to cool further, with quarterly growth seen slowing to 0.9% and annual growth easing slightly to 5.1%.
China’s June industrial production is expected to slow to 5.6% year-on-year, down from 5.8% in May and easing further from the strong 7.7% annual gain seen in March.
Retail sales are forecast to decelerate to 5.6%, compared to 6.4% in May, after marking the strongest growth in over a year back in March. Fixed asset investment is likely to edge down to 3.6% from May’s 3.7%, still weighed by continued weakness in real estate investment, which had dropped 9.9% year-on-year in March. The unemployment rate, which came in below expectations at 5.2% in March, will be closely watched to see if it holds steady amid signs of softer domestic demand.
In Japan, upcoming trade data will be critical ahead of the new 25% U.S. tariff due August 1, while inflation and machinery orders may shape expectations for policy tweaks.
India’s consumer price inflation cooled for the eighth consecutive month, dropping to 2.1% in June 2025, its lowest level since January 2019, down from 2.82% in May and below market forecasts of 2.5%.
Australia’s consumer sentiment and jobs data will test the resilience of household spending and labor demand.
Singapore’s GDP and Indonesia’s central bank decision will also add to a busy Asia-Pacific calendar.
