

Global Markets Recap
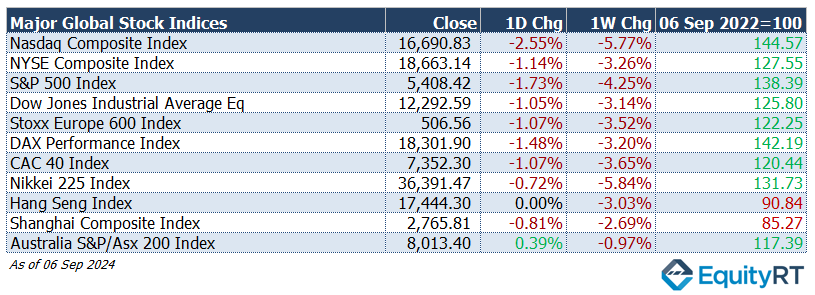
Wall Street ended sharply lower on Friday with tech stocks leading the decline as weaker-than-expected August non-farm payrolls and downward revisions for the previous two months signaled a cooling labor market. Investors are now focusing on Wednesday’s U.S. inflation data for clarity ahead of next week’s Fed meeting.
- Nasdaq Composite Index dropped 2.55%, closing at 16,690.33.
- NYSE Composite Index fell 1.14%, ending at 18,663.14.
- S&P 500 Index declined 1.73%, finishing at 5,408.42.
- Dow Jones Industrial Average EW decreased 1.05%, settling at 12,292.59.
European stocks also ended the week negatively:
- Stoxx Europe 600 Index dropped 1.07%, closing at 506.56.
- Germany’s DAX Performance Index fell by 1.48%, ending at 18,301.90.
- France’s CAC 40 Index declined by 1.07%, finishing at 7,352.30.
Asia-Pacific Markets traded mixed on Friday:
- Japan’s Nikkei 225 Index slipped 0.72%, closing at 36,391.47.
- China’s Shanghai Composite Index decreased by 0.81%, ending at 2,765.81.
- Australia’s S&P/ASX 200 Index rose 0.39%, finishing at 8,013.40.

The Dollar Index (#DXY), a closely watched gauge of the U.S. dollar’s performance against other major currencies, closed last week at 101.18, marking a 0.11% daily increase and a -0.54% loss for the week.
The Brent crude oil (#LCO07) a global benchmark for oil prices, ended the week at $71.06 per barrel, falling by 2.24% on the day and marking a 7.63% decline over the week.
The price of gold (#XAU) finished last week at $2,487.00 per ounce, reflecting a 1.20% daily decrease and a 0.64% weekly decline.
The 2-year U.S. Treasury yield (#USGG2YR), particularly responsive to Federal Reserve policy rates, dropped by 9.80 basis points to 3.65%, recording a weekly fall of 26.90 basis points.
The 10-year U.S. Treasury yield (#USGG10YR) decreased by 2.00 basis points, ending at 3.71%, with a 19.50 basis point decline over the week.

Take the Guesswork out of Investing: Backtest Your Strategies with Ease!
U.S. Economic Indicators: Last Week’s Highlights
- Employment Data
In August, non-farm payrolls increased from 89,000 to 142,000, falling short of expectations (165,000). Previous months’ figures were revised downward by 25,000 for July and 61,000 for June. This growth was below the 12-month average of 202,000.
The unemployment rate dropped to 4.2% from 4.3%, in line with forecasts, with the number of unemployed falling by 48,000 to 7.11 million. Employment rose by 168,000 to 161.4 million.
Wage growth, measured by average hourly earnings, rose by 0.4% in August, above the expected 0.3%, while the annual rate increased slightly from 3.6% to 3.8%.

Unleash Your Investment Potential. EquityRT might be the missing puzzle piece to reach your ultimate investment strategy.
Upcoming U.S. Economic Indicators to Watch This Week
This week in the U.S., we’ll see important economic updates with August’s Consumer Price Index (CPI) set for release on Wednesday and Producer Price Index (PPI) on Thursday.
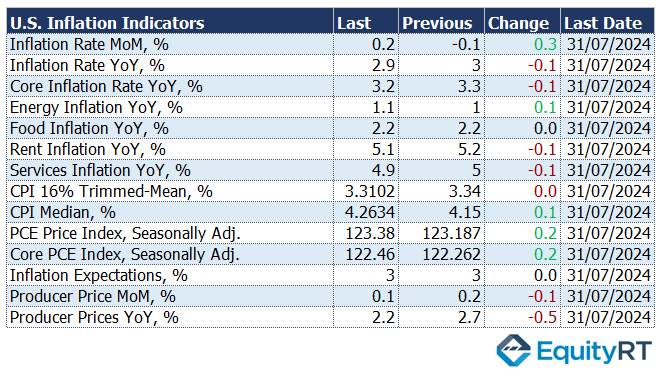
In July, the headline CPI increased by 0.2% monthly and decreased to 2.9% annually, its lowest since March 2021. Core CPI rose by 0.2% monthly and slowed to 3.2% annually. For August, a similar 0.2% monthly increase in headline CPI and a decrease to 2.6% annually are expected. Core CPI is projected to remain at 0.2% monthly and 3.2% annually.
For PPI, a 0.1% monthly increase and a decline to 1.8% annually are anticipated for August. Core PPI is expected to accelerate to 0.2% monthly and hold at 2.5% annually.
Additionally, jobless claims data will be monitored, with recent claims falling to a seven-week low of 227,000, below expectations.
On Friday, the preliminary University of Michigan consumer sentiment index for September will be released, with August’s final reading slightly revised up to 67.9.
Take the Guesswork out of Investing: Backtest Your Strategies with Ease!
European Economic Trends: Last Week’s Market Insights
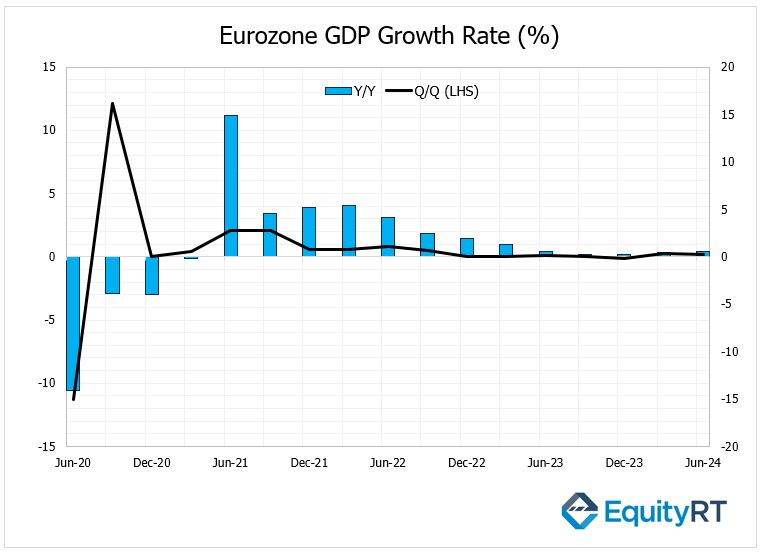
The Eurozone’s GDP growth for Q2 was revised down from 0.3% to 0.2% quarter-on-quarter, while the annual growth rate for the second quarter remained at 0.6%.
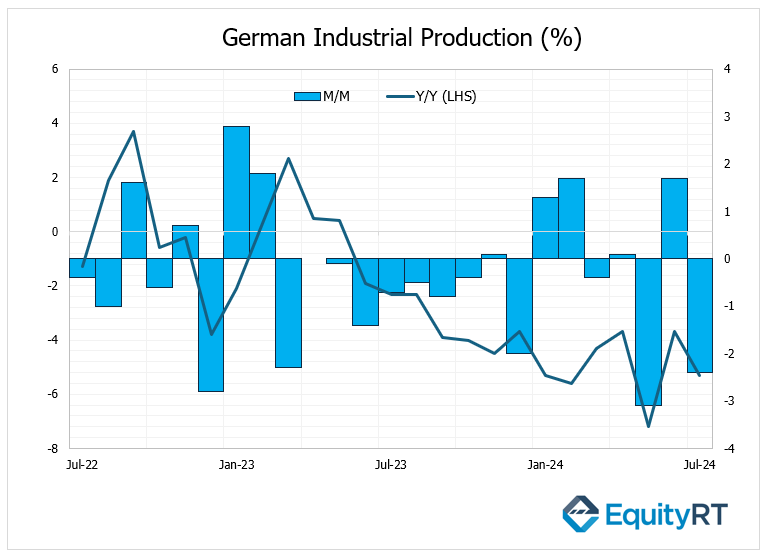
In Germany, industrial production fell by 2.4% in July, after a 1.7% increase in June, exceeding expectations of a 0.3% decline. On an annual basis, the contraction rate of industrial production increased from 3.7% to 5.3%.
Unleash Your Investment Potential. EquityRT might be the missing puzzle piece to reach your ultimate investment strategy.
European Economic Trends: This Week’s Macro Insights
In Europe, all eyes will be on the ECB’s interest rate decision and President Lagarde’s speech on Thursday, along with the release of new macroeconomic projections.
On Tuesday, Germany will release its final August CPI data, with expectations for a -0.1% month-on-month change after a 0.3% increase in July.
On Wednesday, the UK will report its July GDP growth, with a projected monthly increase of 0.2%.
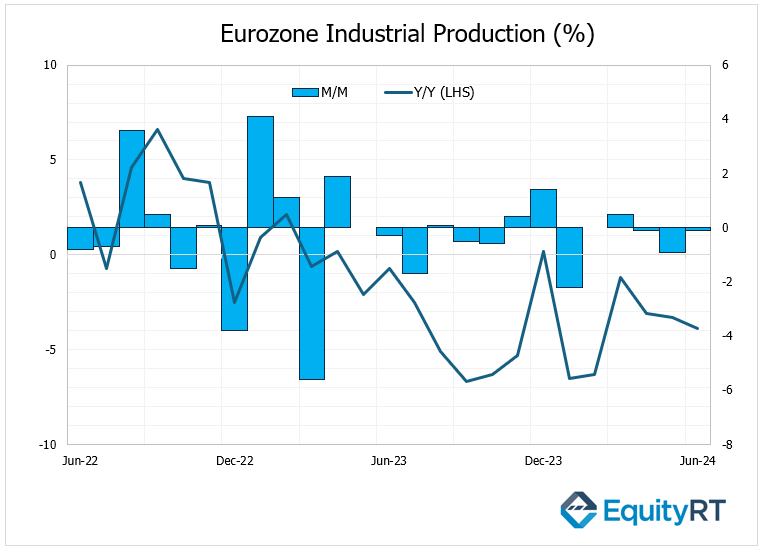
On Friday, the Eurozone’s industrial production for July will be monitored, with a forecasted 0.3% monthly decline, following decreases in May and June.
Take the Guesswork out of Investing: Backtest Your Strategies with Ease!
Asian Economic Data: This Week’s Outlook
Japan’s economy contracted by 0.6% in the first quarter of 2024 and saw its second-quarter growth revised down from 0.8% to 0.7%.
On an annualized basis, the economy shrank by 2.4% in the first quarter and growth was revised down to 2.9% for the second quarter. Despite a slight revision in private consumption, it rose by 0.9% compared to the previous quarter, indicating a recovery in domestic demand.
In China, the Consumer Price Index (CPI) rose by 0.4% month-on-month in August, slightly below expectations. Year-on-year inflation increased from 0.5% to 0.6%, but core CPI slowed to 0.3%, marking its lowest level since March 2021.

Producer Price Index (PPI) dropped by 0.7% in August, the largest decline in 14 months, reflecting weak domestic demand and falling global commodity prices.

In Asia, China’s August trade data will be released on Tuesday, with expected figures showing export growth slowing to 6.6% and import growth significantly decreasing to 2.3%.
On Friday, the focus will shift to the Russian Central Bank’s meeting. The bank is expected to keep its policy interest rate unchanged at 18% during this week’s meeting.
This week in Asia, other key economic releases are scheduled:
Indonesia’s retail sales and vehicle sales data will be monitored along with India’s industrial production, inflation rates, and manufacturing production data.