Global Stock Market Highlights
On Friday, following Trump’s announcement that the U.S. will impose higher tariffs on China, growing concerns over renewed trade tensions between the two countries led Wall Street indices to close sharply lower, driven primarily by declines in technology stocks.
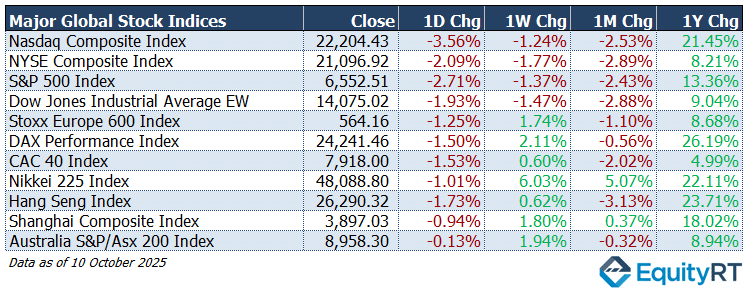
- Nasdaq Composite Index closed at 22,204.43, down 3.56% on the day, 1.24% lower for the week, 2.53% lower over the month, and 21.45% higher over the year.
- NYSE Composite Index closed at 21,096.92, down 2.09% on the day, 1.77% lower for the week, 2.89% lower over the month, and 8.21% higher over the year.
- S&P 500 Index closed at 6,552.51, down 2.71% on the day, 1.37% lower for the week, 2.43% lower over the month, and 13.36% higher over the year.
- Dow Jones Industrial Average EW closed at 14,075.02, down 1.93% on the day, 1.47% lower for the week, 2.88% lower over the month, and 9.04% higher over the year.
European markets finished the week on a soft note, with equities slipping in the final trading hours. The STOXX 600 declined as broad-based sector losses reflected investor caution over escalating trade tensions.
- Stoxx Europe 600 Index closed at 564.16, down 1.25% on the day, 1.74% higher for the week, 1.10% lower over the month, and 8.68% higher over the year.
- DAX Performance Index closed at 24,241.46, down 1.50% on the day, 2.11% higher for the week, 0.56% lower over the month, and 26.19% higher over the year.
- CAC 40 Index closed at 7,918.00, down 1.53% on the day, 0.60% higher for the week, 2.02% lower over the month, and 4.99% higher over the year.
Asia-Pacific markets tracked Wall Street’s downturn as renewed U.S.–China trade tensions weighed on sentiment. In China, both the Shanghai Composite and CSI 300 slipped following tariff-related concerns, while Hong Kong’s Hang Seng also retreated. Japan’s major indices declined, and Australian stocks closed slightly lower.
- Nikkei 225 Index closed at 48,088.80, down 1.01% on the day, 6.03% higher for the week, 5.07% higher over the month, and 22.11% higher over the year.
- Hang Seng Index closed at 26,290.32, down 1.73% on the day, 0.62% higher for the week, 3.13% lower over the month, and 23.71% higher over the year.
- Shanghai Composite Index closed at 3,897.03, down 0.94% on the day, 1.80% higher for the week, 0.37% higher over the month, and 18.02% higher over the year.
- Australia S&P/ASX 200 Index closed at 8,958.30, down 0.13% on the day, 1.94% higher for the week, 0.32% lower over the month, and 8.94% higher over the year.
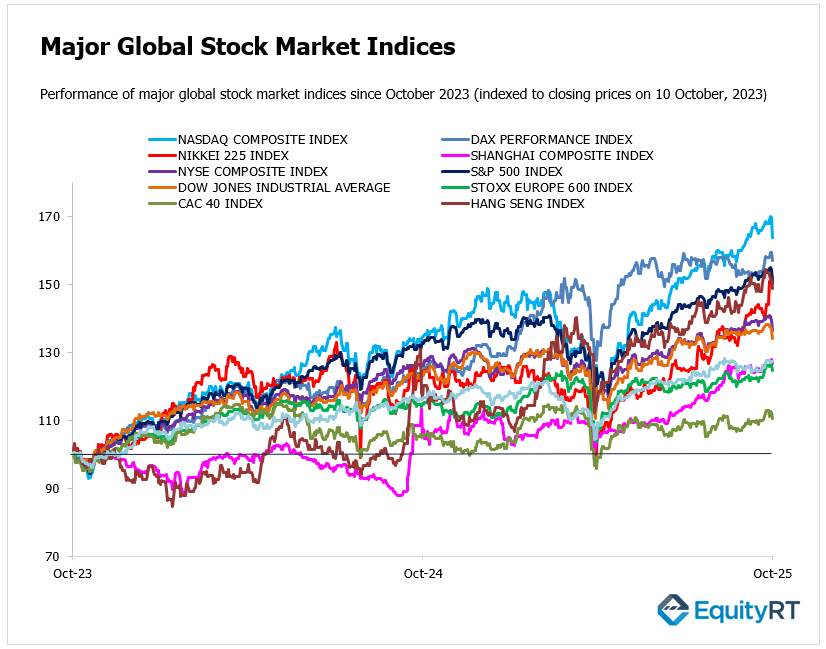
Stock Market Snapshot: Year-to-Date Performance Review
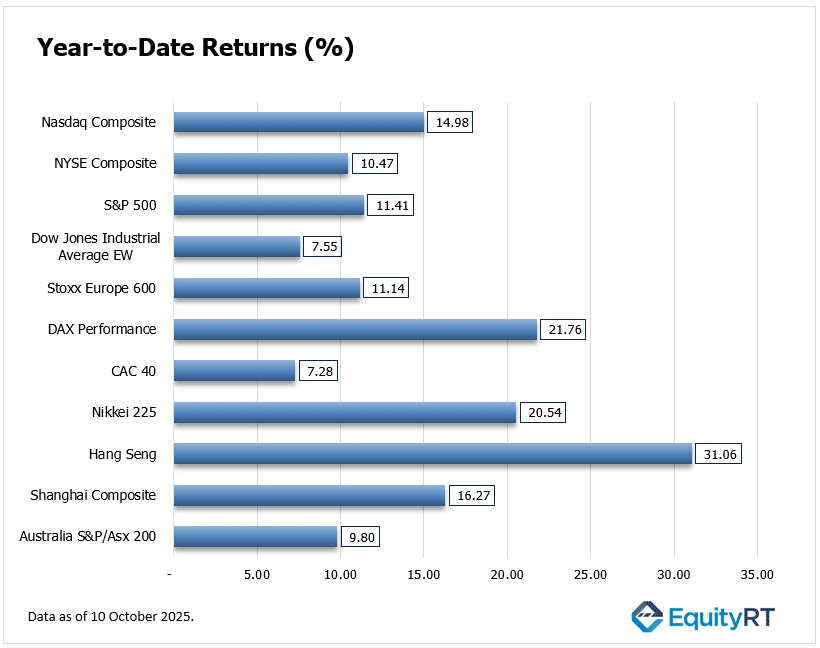
Asia-Pacific markets are leading global gains, with Hong Kong’s Hang Seng Index posting an impressive 31.06% year-to-date (YTD) return. China’s Shanghai Composite and Japan’s Nikkei 225 also delivered solid performance at 16.27% and 20.54%, respectively, reflecting strong momentum across the region. Australia’s S&P/ASX 200 posted more modest growth, up 9.80% YTD.
In Europe, Germany’s DAX Performance Index stands out at 21.76% YTD, ahead of the broader Stoxx Europe 600 at 11.14% and France’s CAC 40 at 7.28%, highlighting Germany’s market resilience.
U.S. equities show steady gains, with the Nasdaq Composite leading at 14.98%, followed by the S&P 500 at 11.41%, NYSE Composite at 10.47%, and the Dow Jones Industrial Average EW at 7.55%, indicating measured growth across major American indices.
Market Snapshot: Dollar, Gold, Oil & U.S. Yields Update
The US Dollar Index (DXY) closed at 98.85, down 0.56% on the day, up 0.68% for the week, and 1.17% over the month, though still 8.85% lower year-to-date. The dollar’s retreat over the year reflects easing expectations for U.S. interest rate hikes and rising concerns about global economic growth.
Brent Crude Oil settled at $62.73 per barrel, falling 3.82% on the day and 9.38% over the week, with a 15.96% drop year-to-date. The decline highlights market concerns over slowing global demand, particularly amid renewed U.S.–China trade tensions, while inventories and production levels continue to weigh on prices.
Gold surged to $4,013.25 per ounce, up 0.96% on the day and 6.49% for the week, posting a 52.92% gain YTD. The rally reflects strong investor appetite for safe-haven assets amid global uncertainty.
Silver rose to $50.28 per ounce, gaining 1.93% on the day and 9.14% over the week, with a staggering 74.11% year-to-date increase. Silver’s performance mirrors gold’s safe-haven appeal, while also benefiting from industrial demand expectations.
The 2-Year U.S. Treasury yield dropped to 3.51 bps, falling 9.30 bps on the day and 13.50 bps for the week. The sharp retreat highlights market expectations for a potential pause or slowdown in Federal Reserve rate hikes in the near term, as short-term yields reacted to softer economic signals.
The 10-Year U.S. Treasury yield fell to 4.04 bps, down 10.80 bps on the day and 14.00 bps for the week.
** The US bond market will be closed on Monday for Columbus Day, while stock markets will remain open.

Take the Guesswork out of Investing: Backtest Your Strategies with Ease!
Weekly Macro Highlights
Americas
As the US government shutdown enters its third week, the release of key economic indicators, including CPI, PPI, retail sales, housing starts, building permits, and import/export prices, is expected to remain delayed.
Nevertheless, traders will still receive updates from other sources, such as industrial production, the NAHB housing market index, the Philadelphia Fed and New York Fed manufacturing surveys, and the NFIB Small Business Optimism Index.
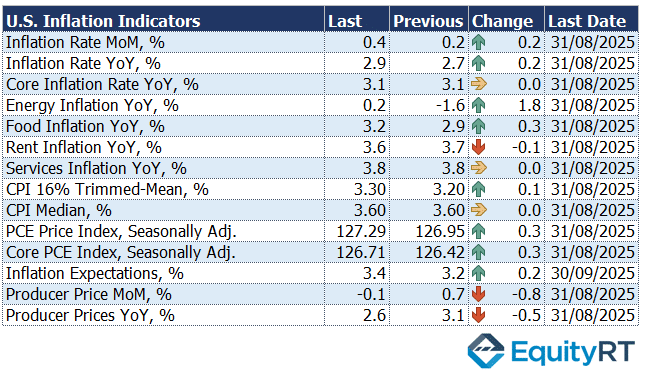
In the United States, headline CPI in August recorded its largest increase since January, slightly above expectations, while core CPI rose in line with forecasts. Year-on-year, headline CPI increased from 2.7% to 2.9%, whereas core CPI remained steady at 3.1%. Meanwhile, the PPI surprised markets by declining 0.1% month-on-month in August, against an expected 0.3% rise. On an annual basis, PPI rose 2.6%, with the previous period’s figure revised down to 3.1%. These figures add to the growing evidence supporting the possibility of future Fed rate cuts. Amid ongoing economic uncertainty and subdued consumer spending, companies may continue to exercise caution in investment and hiring decisions, keeping the broader growth outlook muted.
Earnings season kicks off this week, with major banks including Citigroup, Goldman Sachs, JPMorgan Chase, Wells Fargo, Bank of America, and Morgan Stanley scheduled to report.
Other notable companies releasing quarterly results include BlackRock, Johnson & Johnson, American Express, Abbott Laboratories, Progressive, and Charles Schwab. Several Federal Reserve officials are also set to speak, with Chair Powell addressing the National Association for Business Economics (NABE) Annual Meeting.
Unleash Your Investment Potential. EquityRT might be the missing puzzle piece to reach your ultimate investment strategy.
Europe
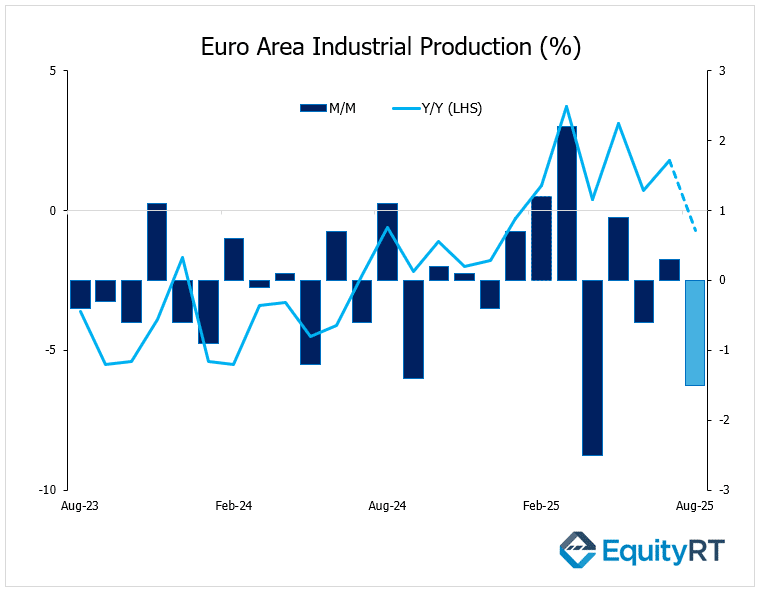
Following a 0.6% monthly decline in industrial production in June, the Euro Area saw a modest 0.3% increase in July. The strongest gains in July were recorded in the production of non-durable consumer goods, while increases in intermediate goods, durable consumer goods, and capital goods were more limited. In contrast, energy production registered a notable decline.
Markets are currently anticipating that August industrial production may face renewed pressure, with expectations for a possible contraction or only a slight increase, reflecting ongoing softness in the region’s manufacturing sector.
The Euro Area’s industrial production data for August is scheduled to be released by Eurostat on Wednesday.
In Germany, the ZEW Indicator of Economic Sentiment is forecast to rise to 39.5 in October, a three-month high, yet still below July’s 52.7, indicating cautious optimism. Across the bloc, final inflation readings for October will be released.
In the United Kingdom, a packed data week includes labor market and GDP updates. The unemployment rate is expected to remain at 4.7%, its highest since August 2021, while total average weekly earnings, including bonuses, are projected to hold at 4.7%.
GDP is forecast to grow 0.2% month-on-month in August after stalling in July, supported by rebounds in industrial and manufacturing output.
Additional releases will cover Euro Area and Italian trade balances, and the UK’s BRC retail sales.
Take the Guesswork out of Investing: Backtest Your Strategies with Ease!
Asia Pacific
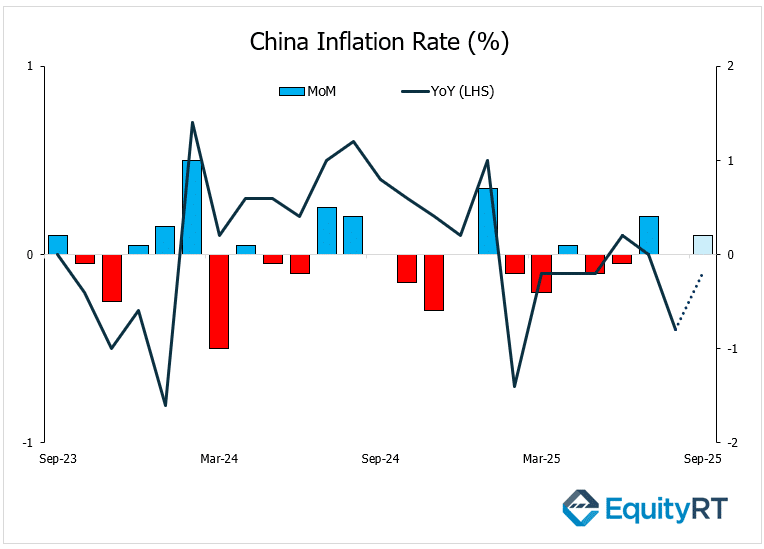
China is seeing a busy week of economic data following the Golden Week holidays, with a focus on trade figures ahead of the anticipated Trump–Xi talks later this month.
China’s exports climbed 8.3% year-on-year in September 2025, exceeding the 6% forecast and recording the strongest increase since March, fueled by strong global demand and companies expanding into new markets. Imports also surged 7.4%, well above the projected 1.5%, marking the fastest growth since April 2024, supported by robust domestic demand ahead of the Golden Week holidays and continued government-led infrastructure spending.
Deflationary pressures are forecast to ease, with CPI down 0.1% YoY and PPI falling 2.3%. Monetary and credit indicators will also draw attention, with new yuan loans expected to more than double from the previous month.
In Japan, a holiday-shortened week will see few releases, including final industrial production and machinery orders for August, while traders monitor political developments after reports that the Komeito Party plans to leave the ruling coalition with the LDP.
In India, inflation data will be in focus, with consumer prices projected to slow to 1.7% from 2.07% and wholesale inflation (WPI) likely unchanged at 0.5%.
In Australia, attention shifts to September employment data, expected to show a 17,000 increase in jobs and a slight rise in the unemployment rate to 4.3%, while the RBA meeting minutes will be closely watched.
Investors in the region also await third-quarter GDP and September trade figures from Singapore and Malaysia.
