Global Market Summary
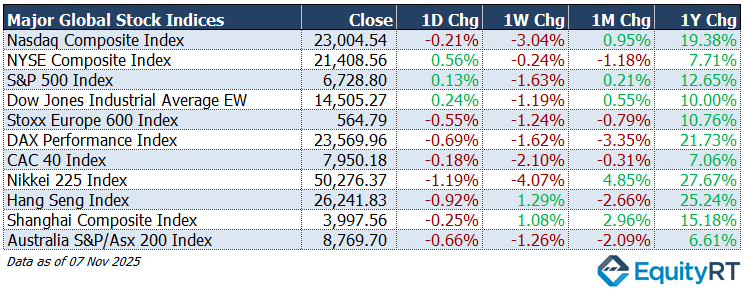
Global equities ended the week on a mixed note, with U.S. indices struggling to regain momentum after recent gains, while Europe and Asia saw broader pullbacks.
The Nasdaq and S&P 500 slipped as investors assessed earnings and softer economic data, while the Dow managed slight daily gains.
In Europe, major indices like the DAX and Stoxx 600 declined amid growth concerns and weak factory data.
In Asia, sentiment was cautious, the Nikkei retreated sharply after a strong month, and China’s markets remained steady, supported by policy expectations.
- Nasdaq Composite Index closed at 23,004.54, down 0.21% on the day, 3.04% lower for the week, 0.95% higher over the month, and 19.38% higher over the year.
- NYSE Composite Index closed at 21,408.56, up 0.56% on the day, 0.24% lower for the week, 1.18% lower over the month, and 7.71% higher over the year.
- S&P 500 Index closed at 6,728.80, up 0.13% on the day, 1.63% lower for the week, 0.21% higher over the month, and 12.65% higher over the year.
- Dow Jones Industrial Average EW closed at 14,505.27, up 0.24% on the day, 1.19% lower for the week, 0.55% higher over the month, and 10.00% higher over the year.
- Stoxx Europe 600 Index closed at 564.79, down 0.55% on the day, 1.24% lower for the week, 0.79% lower over the month, and 10.76% higher over the year.
- DAX Performance Index closed at 23,569.96, down 0.69% on the day, 1.62% lower for the week, 3.35% lower over the month, and 21.73% higher over the year.
- CAC 40 Index closed at 7,950.18, down 0.18% on the day, 2.10% lower for the week, 0.31% lower over the month, and 7.06% higher over the year.
- Nikkei 225 Index closed at 50,276.37, down 1.19% on the day, 4.07% lower for the week, 4.85% higher over the month, and 27.67% higher over the year.
- Hang Seng Index closed at 26,241.83, down 0.92% on the day, 1.29% higher for the week, 2.66% lower over the month, and 25.24% higher over the year.
- Shanghai Composite Index closed at 3,997.56, down 0.25% on the day, 1.08% higher for the week, 2.96% higher over the month, and 15.18% higher over the year.
- Australia S&P/ASX 200 Index closed at 8,769.70, down 0.66% on the day, 1.26% lower for the week, 2.09% lower over the month, and 6.61% higher over the year.


Global Stock Markets: Year-to-Date Performance Review
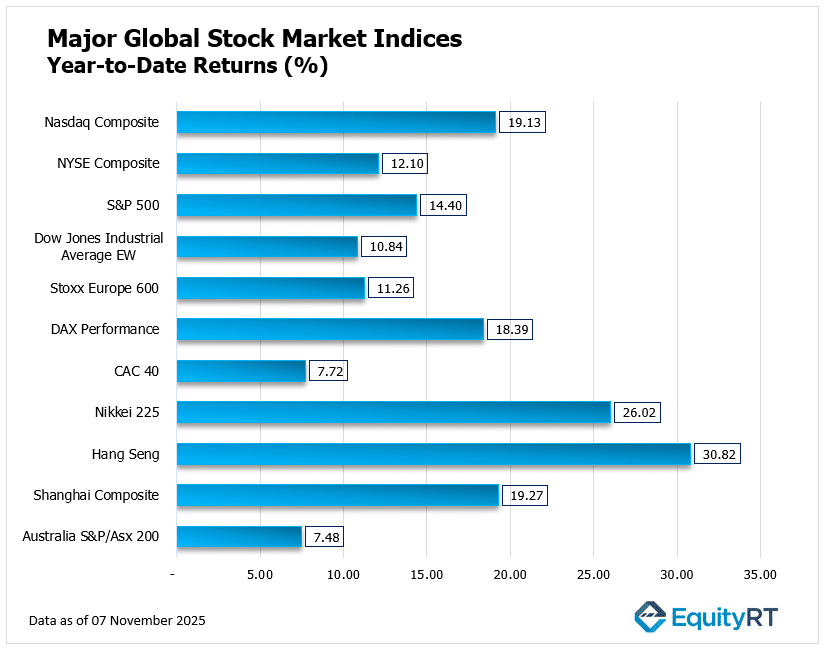
Global equities have posted solid year-to-date gains, led by a strong rally in Asian markets. The Hang Seng Index tops global benchmarks with a 30.82% rise, followed by Nikkei 225, up 26.02%, as investor optimism around tech and export sectors continues.
In the U.S., the Nasdaq Composite gained 19.13%, outpacing the S&P 500 (14.40%) and Dow Jones Industrial Average (10.84%), driven by resilience in technology and communication services stocks.
Across Europe, the DAX advanced 18.39%, while the Stoxx Europe 600 and CAC 40 delivered moderate gains of 11.26% and 7.72%, respectively.
In the Asia-Pacific region, the Shanghai Composite rose 19.27%, while Australia’s ASX 200 lagged with a 7.48% increase.

Market Summary: Dollar, Gold, Oil & U.S. Yields Update
The U.S. dollar weakened slightly, while oil prices remained subdued amid ongoing demand concerns. Gold and silver extended gains, supported by safe-haven demand and expectations of lower yields.
Treasury yields were mixed, with the short end edging down and the 10-year rate firming modestly, reflecting cautious investor sentiment ahead of key U.S. economic data releases.
- US Dollar Index (DXY) closed at 99.54, down 0.18% on the day, 0.19% lower for the week, 0.95% higher over the month, and 8.22% lower year-to-date.
- Brent Crude Oil closed at $63.63 per barrel, up 0.39% on the day, 1.76% lower for the week, 2.78% lower over the month, and 14.75% lower year-to-date.
- Gold closed at $4,000.98 per ounce, up 0.60% on the day, 0.09% lower for the week, 0.38% higher over the month, and 52.45% higher year-to-date.
- Silver closed at $48.50 per ounce, up 0.98% on the day, 0.61% lower for the week, 1.40% higher over the month, and 67.94% higher year-to-date.
- 2-Year U.S. Treasury Yield stood at 3.57 bps, down 0.20 bps on the day, 1.40 bps lower for the week, 0.80 bps lower over the month, and 68.40 bps lower year-to-date.
- 10-Year U.S. Treasury Yield stood at 4.10 bps, up 1.60 bps on the day, 2.50 bps higher for the week, 2.70 bps lower over the month, and 47.20 bps lower year-to-date.

Take the Guesswork out of Investing: Backtest Your Strategies with Ease!
Weekly Macro Highlights: Market Takeaway
The U.S. government reopened after a 40-day shutdown, following a bipartisan agreement in the Senate on a temporary funding bill that keeps operations running through the end of January. The measure passed both chambers and was signed into law by President Trump, allowing key economic data releases to gradually resume in the coming weeks.
In Europe, investors will look for fresh GDP and labor market data from the UK, alongside industrial production figures across the Eurozone.
In Asia, the focus turns to a heavy data week for China, including reports on industrial production, retail sales, property prices, and credit activity, while Japan publishes new GDP estimates.
The earnings season is ending but remains active, with results due from Cisco, Disney, and Applied Materials in the U.S., and from Tencent, Alibaba, Softbank, Sony, Siemens, Munich Re, and Allianz.
U.S. Outlook: Inflation, Jobs, and Fed Watch
With the government reopened, investors will refocus on upcoming CPI and retail sales data, alongside ADP employment and the NFIB Small Business Optimism Index. The labor market is expected to show modest cooling, while business sentiment likely remains soft.
Federal Reserve officials’ speeches will be closely followed for any hints on the December policy outlook, especially after recent dovish comments suggesting rate cuts may still be on the table in early 2026.
Elsewhere in the Americas, focus will shift to Brazil’s inflation, retail sales, and business confidence, providing insight into regional growth trends.
Unleash Your Investment Potential. EquityRT might be the missing puzzle piece to reach your ultimate investment strategy.
Europe: Growth Cooling, Inflation Easing
The UK faces a busy week, with GDP, employment, and industrial production data expected to underline its sluggish recovery.
The GDP data, due Thursday, will be closely watched for signs of stabilization or further slowdown in the UK’s economic outlook.
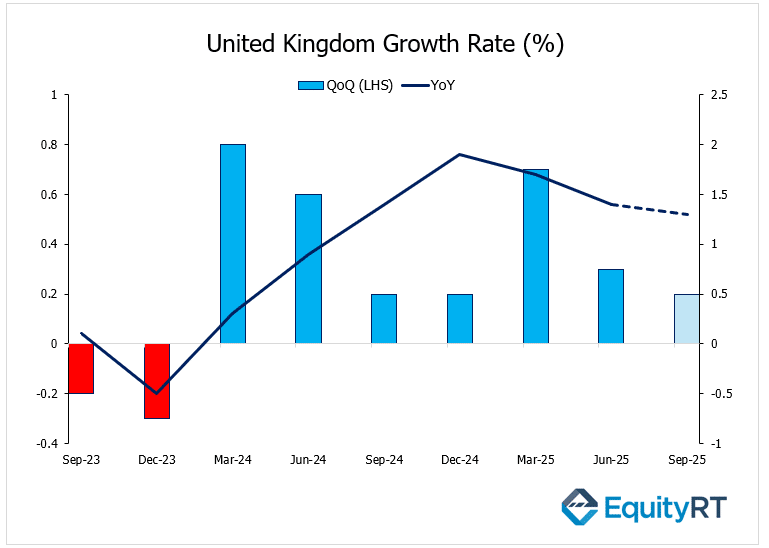
The UK economy grew 0.2% quarter-on-quarter in Q3 2025, confirming a sluggish pace of expansion. September output is expected to remain flat, underscoring weak momentum heading into the fourth quarter. According to analysts, growth remains fragile amid subdued business investment and soft consumer demand, with full-year expansion projected to be near 1.5%.
Markets view the combination of stubbornly high inflation and slow growth as a signal that the Bank of England may delay policy easing, keeping rates higher for longer despite weakening economic conditions.

At the same time, the unemployment rate is expected to rise to 4.9%, the highest since mid-2021, while wage growth is easing, reflecting cooling inflation pressures.
Across the Eurozone, attention will center on industrial production, employment, and the trade balance.
The ZEW sentiment survey in Germany is expected to improve, while France faces a higher unemployment rate (7.6%). Italy’s industrial output may rebound after steep declines, and final inflation readings for Germany, France, and Spain will help confirm disinflation momentum.
Take the Guesswork out of Investing: Backtest Your Strategies with Ease!
Asia-Pacific: China Data in Focus, Japan’s GDP Ahead
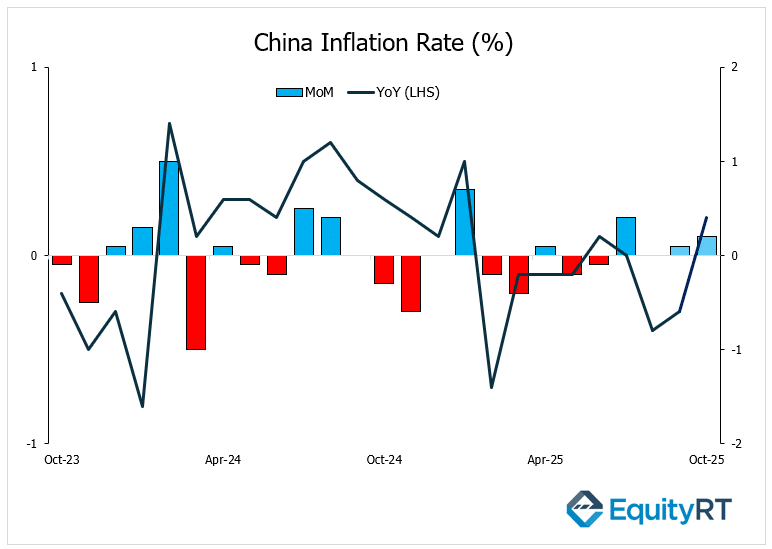
China’s upcoming data releases will dominate the regional agenda. October CPI unexpectedly rose by 0.2% year-on-year, ending a streak of deflation. The PPI continued to decline but the fall narrowed to -2.1% year-on-year, versus -2.3% in September.

Industrial production and retail sales are still expected to expand (forecasts of nearly 5.6% and 2.7% respectively), though both are likely moderating from prior months. Fixed-asset investment is projected to shrink once again, and credit growth is expected to weaken sharply, signaling softness in domestic demand.
In Japan, markets await Q3 GDP estimates, along with data on wages, current account, and producer prices. The Bank of Japan’s Summary of Opinions may offer clues on the timing of potential rate adjustments.
Elsewhere in the region, India’s inflation is expected to ease, Australia’s labor data should show minor improvement, and updates from South Korea, New Zealand, Malaysia, and Hong Kong will provide a snapshot of Asia’s mixed economic momentum.
