Global Stock Market Highlights
U.S. equities ended the last week on a positive note, with major benchmarks advancing despite midweek volatility linked to regional banking concerns. Investor sentiment strengthened as financial stocks stabilized and signs of easing trade tensions between the U.S. and China supported risk appetite.
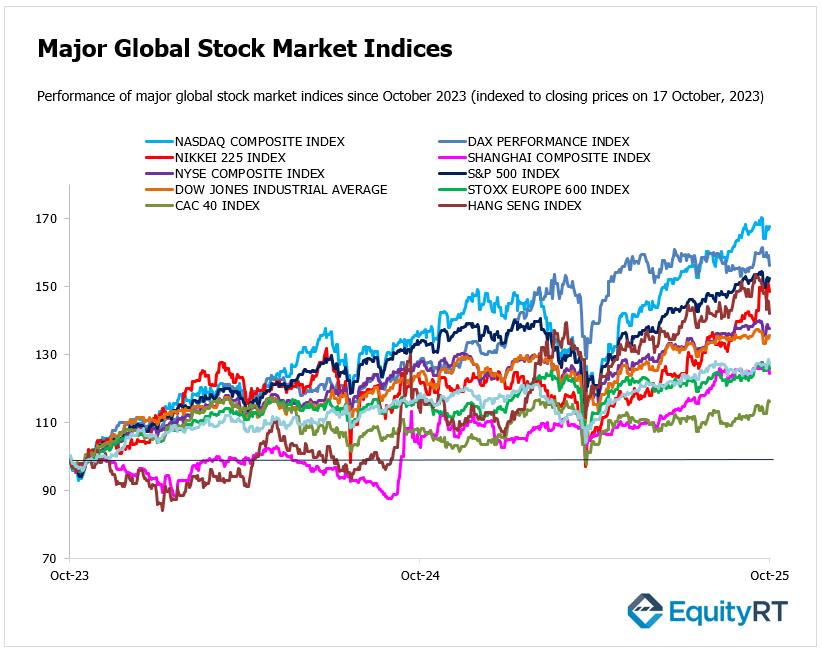
- Nasdaq Composite Index closed at 22,679.98, up 0.52% on the day, 2.14% higher for the week, 1.88% higher over the month, and 23.44% higher over the year.
- NYSE Composite Index closed at 21,411.45, up 0.16% on the day, 1.49% higher for the week, 0.13% lower over the month, and 7.84% higher over the year.
- S&P 500 Index closed at 6,664.01, up 0.53% on the day, 1.70% higher for the week, 0.96% higher over the month, and 14.08% higher over the year.
- Dow Jones Industrial Average (Equal Weight) closed at 14,318.22, up 0.73% on the day, 1.73% higher for the week, 0.31% higher over the month, and 8.72% higher over the year.
Europe’s markets showed limited upside for the week, with gains restrained by financial-sector anxieties and global risk-off triggers.
- Stoxx Europe 600 Index closed at 566.24, down 0.95% on the day, 0.37% higher for the week, 2.83% higher over the month, and 8.08% higher over the year.
- DAX Performance Index closed at 23,830.99, down 1.82% on the day, 1.69% lower for the week, 2.02% higher over the month, and 21.69% higher over the year.
- CAC 40 Index closed at 8,174.20, down 0.18% on the day, 3.24% higher for the week, 4.97% higher over the month, and 7.79% higher over the year.
The Asia-Pacific region reported mixed to weak performance last week. For example, the Hang Seng Index in Hong Kong fell on Friday, and the Nikkei 225 in Japan dropped. China’s Shanghai Composite Index saw smaller moves but remained under pressure amid global risk-off conditions.
- Nikkei 225 Index closed at 47,582.15, down 1.44% on the day, 1.05% lower for the week, 6.23% higher over the month, and 22.28% higher over the year.
- Hang Seng Index closed at 25,247.10, down 2.48% on the day, 3.97% lower for the week, 6.17% lower over the month, and 25.74% higher over the year.
- Shanghai Composite Index closed at 3,839.76, down 1.95% on the day, 1.47% lower for the week, 0.94% lower over the month, and 21.15% higher over the year.
- Australia S&P/ASX 200 Index closed at 8,995.30, down 0.81% on the day, 0.41% higher for the week, 2.00% higher over the month, and 7.65% higher over the year.
Stock Market Snapshot: Year-to-Date Performance Review
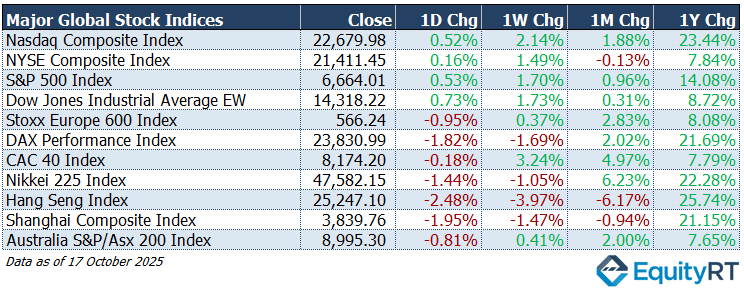
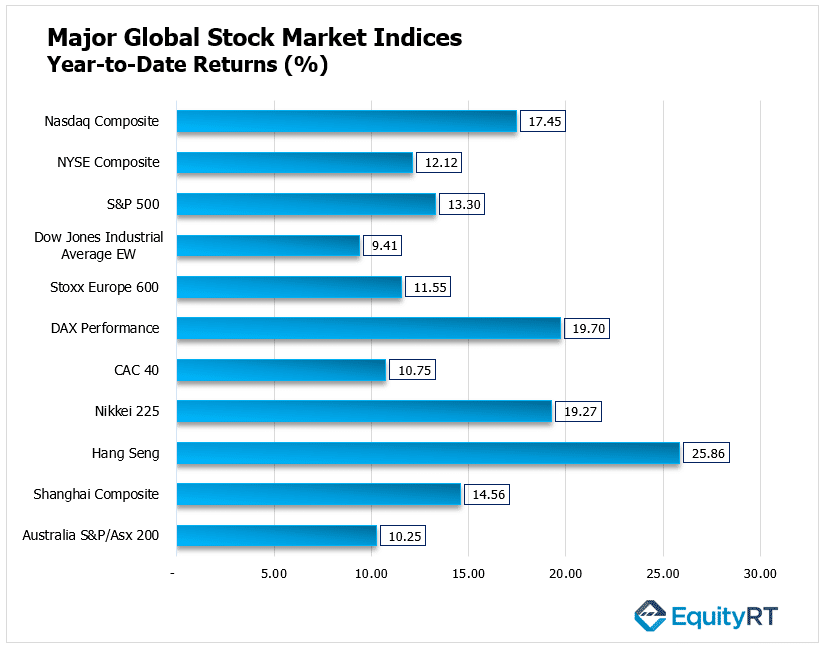
Asia-Pacific markets are leading global gains, with Hong Kong’s Hang Seng Index posting a 25.86% year-to-date (YTD) return. Japan’s Nikkei 225 followed closely with 19.27%, while China’s Shanghai Composite rose 14.56%, reflecting continued investor confidence across the region. Australia’s S&P/ASX 200 delivered a more modest 10.25% increase YTD.
In Europe, Germany’s DAX Performance Index remains a top performer at 19.70% YTD, ahead of the Stoxx Europe 600 at 11.55% and France’s CAC 40 at 10.75%, underscoring the relative strength of the German market.
U.S. equities also show steady gains, with the Nasdaq Composite up 17.45%, followed by the S&P 500 at 13.30%, the NYSE Composite at 12.12%, and the Dow Jones Industrial Average EW at 9.41%, reflecting broad-based but measured optimism across major American indices.
Market Snapshot: Dollar, Gold, Oil & U.S. Yields Update
U.S. Dollar Index (DXY) closed at 98.54, up 0.18% on the day, but 0.31% lower for the week. The index rose 1.64% over the month yet remained 9.14% lower year-to-date, reflecting continued weakness amid expectations of a softer monetary stance by the Federal Reserve.
Brent Crude Oil settled at $61.29 per barrel, gaining 0.38% on the day but falling 2.30% for the week, 9.80% over the month, and 17.89% year-to-date. The persistent decline underscores investor concerns over global demand and supply imbalances in the energy market.
Gold closed at $4,250.15 per ounce, down 1.81% on the day but posting strong gains of 5.90% for the week and 16.12% over the month. The metal has surged 61.95% year-to-date, supported by safe-haven flows amid market uncertainty and lower real yields.
Silver settled at $51.94 per ounce, falling 4.17% on the day but up 3.30% for the week and 24.62% over the month. With a 79.85% year-to-date gain, silver continues to outperform as both an industrial and precious metal play.
2-Year U.S. Treasury Yield stood at 3.47%, rising 4 basis points on the day but down 4 bps over the week and 10 bps over the month, with a 78-bps decline since the start of the year. The move reflects growing expectations for rate cuts later in the year.
10-Year U.S. Treasury Yield closed at 4.01%, up 4 bps on the day, while easing 2.2 bps over the week and 7.1 bps over the month. The benchmark yield has fallen 56.2 bps year-to-date, mirroring shifting sentiment toward slower economic growth and easing inflation pressures.

Take the Guesswork out of Investing: Backtest Your Strategies with Ease!
Weekly Macro Highlights
Global markets entered the new week with a cautious tone as investors balanced mixed economic signals and ongoing geopolitical uncertainty. Attention is centering on a series of major data releases, including inflation updates, PMI readings, and China’s GDP report, while the U.S. corporate earnings season gathers momentum. Meanwhile, central banks across several emerging markets are expected to announce policy decisions amid moderating inflation pressures.
United States: Eyes on CPI and Earnings Season Intensifies
In the U.S., focus remains on developments in the U.S.–China trade dispute, with investors watching closely for any signs of escalation or easing tensions. The corporate earnings season will accelerate, featuring reports from major companies such as Tesla, Procter & Gamble, General Electric, Coca-Cola, Netflix, IBM, AT&T, Verizon, and Intel.
Although the federal government shutdown is set to enter its fourth week, market participants will turn to the CPI report, the only major release from government agencies since October 1.
September inflation is projected to accelerate to 3.1%, the highest since May 2024, while core inflation is expected to hold steady at 3.1%. Monthly readings of 0.4% (headline) and 0.3% (core) indicate that inflationary pressures remain contained.
Other key data to watch include S&P Global flash PMIs, existing home sales, and the Chicago Fed National Activity Index, which will provide further insights into the U.S. economy’s momentum.
Americas: Inflation Data from Canada, Brazil, and Mexico
In Canada, investors will focus on inflation and retail sales data, both key indicators for the Bank of Canada’s next policy steps.
In Latin America, Brazil and Mexico will release mid-month inflation figures, offering a regional view on how price trends are evolving amid softer commodity markets and shifting global rate expectations.
Unleash Your Investment Potential. EquityRT might be the missing puzzle piece to reach your ultimate investment strategy.
Europe: Flash PMIs, and Inflation
In Europe, the spotlight will be on flash PMI data for the Euro Area, Germany, France, and the UK, which are expected to show weaker services activity and a deeper contraction in manufacturing, pointing to sluggish growth momentum across the region.
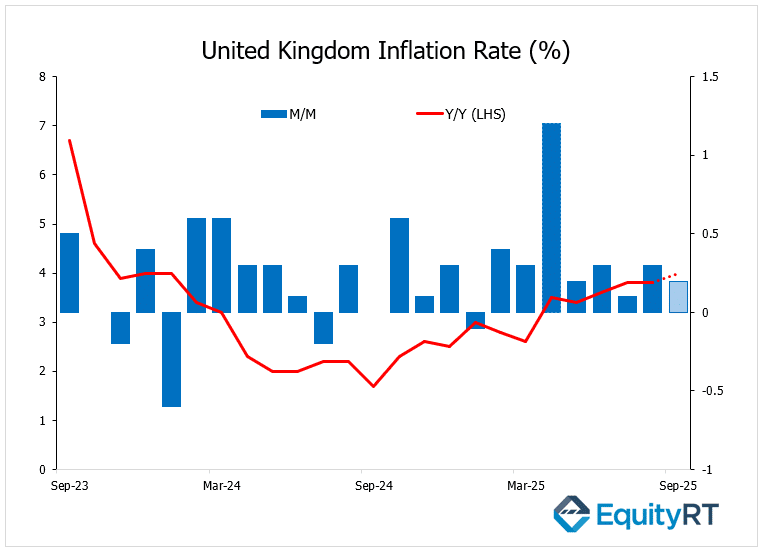
In the UK, focus will also shift to key data on inflation and retail sales. The Bank of England anticipates inflation to rise to around 4%, while retail activity may weaken.
UK inflation data, due Wednesday, is expected to show headline CPI rising to about 4% in September from 3.8% in August, the highest in several months. The uptick underscores persistent price pressures and supports expectations that the Bank of England will maintain a cautious policy stance, with rate cuts unlikely before 2026. A 4% reading would further signal that inflation is cooling only gradually toward target.
Other key data released today include Euro Area consumer confidence, Germany’s producer price index, the UK’s CBI business and industry surveys, Spain’s unemployment figures, and Switzerland’s trade balance.
Germany’s PPI data showed a 1.7% year-on-year decline in September 2025, easing from a 2.2% fall in August, the steepest drop in 15 months, and marking the seventh consecutive month of annual decreases.
Take the Guesswork out of Investing: Backtest Your Strategies with Ease!
Asia-Pacific: China’s Q3 GDP and Regional Data Flow Ahead
China’s economy expanded by 4.8% year-on-year in Q3 2025, easing from 5.2% in Q2 and marking the slowest growth since Q3 2024. Although in line with expectations, the moderation underscores the strain from persistent U.S.–China trade tensions, weak domestic demand, and a protracted property downturn.
Industrial production rose 6.5% year-on-year in September, the fastest pace since June and above forecasts of 5.0%. The People’s Bank of China (PBoC) kept key lending rates at record lows for a fifth consecutive month in October, maintaining its supportive policy stance. Meanwhile, the unemployment rate rose to 5.2% from August’s six-month high of 5.3%.
Markets will also closely watch the Communist Party’s Fourth Plenum, scheduled for October 20–23, for potential policy signals and updates related to the upcoming 15th Five-Year Plan.
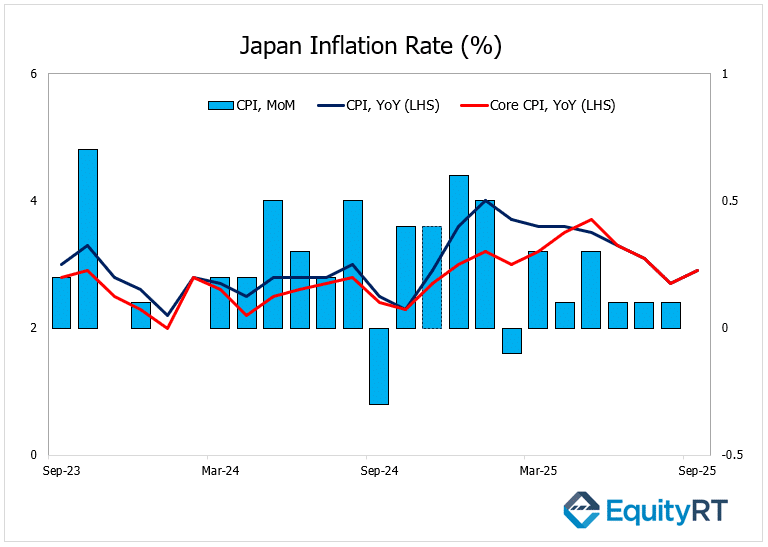
In Japan, attention will turn to September trade and inflation data, with core inflation expected to edge up to 2.9% from 2.7%, alongside the release of October PMI figures.
Flash PMIs will also be released in India and Australia, while India is set to publish infrastructure output data.
New Zealand’s Consumer Price Index (CPI) rose 1% in the third quarter of 2025 from the previous quarter, the largest increase in two years, after a 0.5% gain in the prior three months.
Elsewhere, Singapore, Malaysia, and Hong Kong will release their September inflation reports. Taiwan will publish export orders, and both Bank Indonesia and the Bank of Korea will decide on monetary policy, with Indonesia expected to deliver another 25-bps rate cut, marking its fourth consecutive easing move.
