

Market Focus: US Jobs, Global PMIs and Inflation Put the Rate Outlook Back in Focus
Global markets enter the first week of September with long-term interest rates, labor-market conditions and the global growth outlook firmly in focus.
Long-term sovereign yields remain elevated as investors weigh high energy prices, widening fiscal deficits and heavy AI-related corporate debt issuance against signs that economic growth remains relatively resilient. Against this backdrop, the week's US labor-market data will be particularly important for expectations around the Federal Reserve's next steps.
The August US employment report will be the main event, accompanied by JOLTS, ADP employment and the Fed's Beige Book. At the same time, ISM PMIs, Eurozone inflation and China's first major August activity indicators will provide a broader assessment of whether global growth and inflation pressures are holding up.
US: Jobs Data Take Center Stage
The main event will be Friday's August Employment Situation report, which should provide the clearest test yet of whether July's labor-market weakness was temporary or the beginning of a more meaningful slowdown.
The US economy is expected to have added around 45,000 jobs in August, following the unexpected loss of 23,000 jobs in July. The unemployment rate is forecast to edge up to 4.2% from 4.1%, while average hourly earnings are expected to rise 0.2% month-on-month.
The report will be particularly important for the Fed after policymakers have continued to characterize the economy as operating around full employment. Another weak payroll reading could strengthen the case for a more cautious policy stance, while resilient employment and wage growth could reinforce concerns that inflation pressures remain persistent.
Earlier in the week, JOLTS job openings and ADP employment will provide additional signals on labor demand. The ISM manufacturing and services PMIs are expected to indicate another month of expansion, providing an important counterpoint to signs of labor-market softness.
Investors will also scrutinize the Federal Reserve's Beige Book and remarks from Fed officials, including Michael Barr and Christopher Waller, for further clues on the outlook for rates.
On the corporate side, earnings from Broadcom, Dell, Palo Alto Networks and Snowflake will keep the AI and technology investment story in focus.
Europe: Inflation Returns to Center Stage
Eurozone inflation will be the key European release, particularly as recent national readings have raised concerns that price pressures may be strengthening again.
Annual Eurozone inflation is expected to accelerate to around 3.2% in August, which would mark its highest level since September 2023. German inflation is also expected to rise to around 2.9%, while Italian price growth is forecast to accelerate.
The figures will be important for expectations around the ECB, particularly if stronger inflation coincides with signs that economic activity remains relatively resilient.
Updated manufacturing and services PMIs across several European economies will provide further insight into growth momentum, while Eurozone unemployment is expected to remain at 6.3%. Germany's factory orders will also offer another indication of the health of Europe's largest economy.
Asia-Pacific: China PMIs and Regional Growth in Focus
China's August manufacturing and services PMIs will provide the first major snapshot of economic activity for the month. Investors will be watching closely for evidence that domestic demand and manufacturing conditions are stabilizing after recent signs of weakness.
Japan faces a particularly busy data calendar, including industrial production, retail sales, unemployment, household spending and consumer confidence. Together, the releases should provide a clearer picture of domestic momentum and the outlook for Bank of Japan policy.
Growth will also be in focus elsewhere in the region. India and Australia will release Q2 GDP figures, while a broad set of Asian economies will publish August manufacturing PMIs, inflation and trade data.
Regional monetary policy will remain active. The Reserve Bank of New Zealand is expected to raise its cash rate by 25 basis points to 2.75%, while Bank Negara Malaysia is expected to leave rates unchanged.
What Investors Should Watch
1. Is the US Labor Market Really Weakening?
After July's unexpected payroll decline, the August employment report will be crucial. Another soft reading could reinforce concerns that labor-market momentum is deteriorating, while a rebound would suggest July was more of an anomaly.
2. Are Inflation Pressures Re-emerging?
Eurozone inflation is expected to accelerate, while elevated energy prices remain an important global inflation risk. Persistent price pressures could make it harder for central banks to contemplate easier policy even if growth begins to soften.
3. Can Growth Keep Long-Term Yields Elevated?
ISM surveys in the US, PMIs across Europe and China, and GDP releases from India, Australia and Brazil will test the resilience of the global economy. If growth remains firm while inflation stays elevated, long-term sovereign yields could remain under upward pressure despite signs of a softer US labor market.
Global Equities: AI Earnings Support Stocks, but Hawkish Fed Signals Temper the Rally
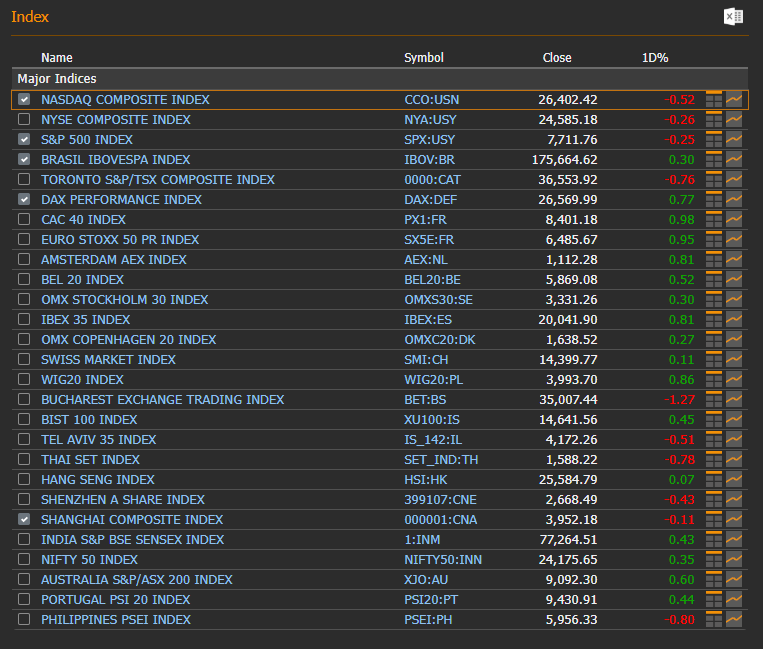
Global equity markets ended the week with a cautiously positive tone, as strong technology earnings helped offset renewed concerns over inflation and the outlook for US interest rates. Nvidia's strong results reinforced confidence in AI-related investment, while Federal Reserve Chair Kevin Warsh's Jackson Hole remarks reminded investors that monetary policy could remain restrictive if inflation fails to move convincingly toward the Fed's 2% target.
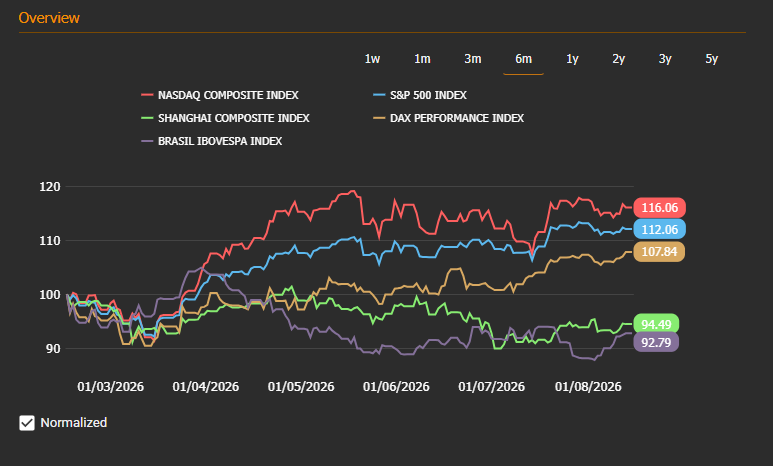
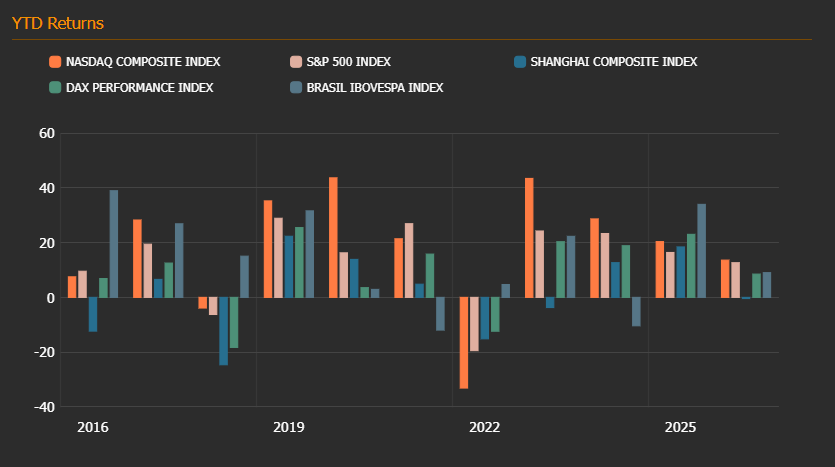
US equities gained for the week but ended Friday cautiously. The Nasdaq Composite gained around 0.9%, while the S&P 500 rose about 0.5% and the Dow added roughly 0.5%. On Friday alone, however, the Nasdaq fell 0.52% and the S&P 500 declined 0.25% as Warsh's comments increased expectations that the Fed could raise rates at its September meeting.
Technology remained a key source of support. Nvidia's stronger-than-expected quarterly results and unusually strong longer-term revenue outlook helped ease concerns that the AI investment boom was losing momentum. The results triggered a broader technology rally on Thursday, although semiconductor shares became more mixed on Friday as investors turned their attention back to interest rates and valuations.
European equities performed relatively well toward the end of the week. The STOXX Europe 600 rose 0.5% on Friday and recorded a modest weekly gain, supported by a rebound in French equities and strength in autos and luxury stocks. However, concerns surrounding France's fiscal outlook and political uncertainty remained an important source of volatility during the week.
Asian markets remained more mixed. Chinese markets continue to face questions over the strength of domestic activity.
Source: EquityRT Markets Overview. Data as of 28/08/2026
Commodity Markets: Gold Holds Firm as Oil Retreats on Hormuz Hopes
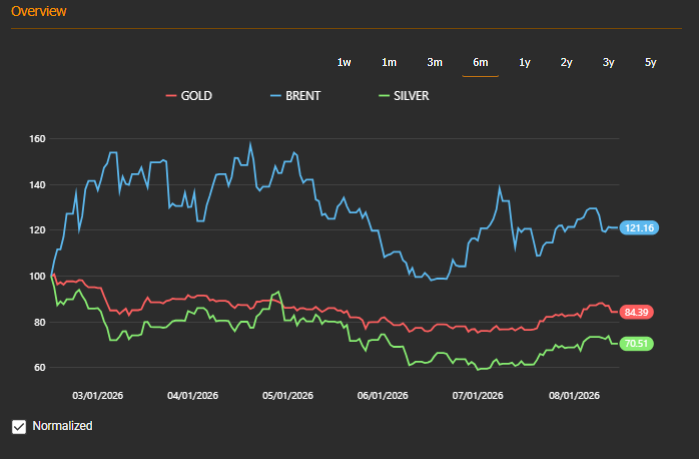
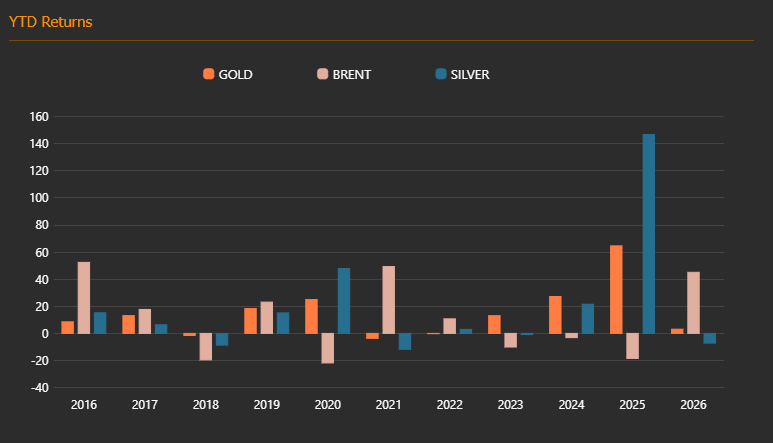
Commodity markets delivered a mixed performance during the week, with gold remaining supported while Brent crude reversed part of its recent rally as investors weighed persistent geopolitical risks against tentative signs of progress toward restoring flows through the Strait of Hormuz.
Brent crude fell more than 5% over the week, reversing part of the gains accumulated earlier in August. Oil prices came under pressure as markets responded to speculation surrounding a potential agreement to improve access through the Strait of Hormuz, alongside signs of a limited recovery in shipping activity. However, flows remain below- normal and the geopolitical backdrop remains highly uncertain, leaving a significant risk premium embedded in energy markets.
The decline came despite continued US pressure on Iran and persistent disruption to one of the world's most important energy corridors. The Strait normally handles around 20% of global oil flows, meaning any renewed deterioration in shipping conditions could quickly return supply concerns to the forefront.
Gold remained comparatively resilient after its strong August recovery. The metal has benefited from volatility in global bond markets, concerns over US fiscal conditions and demand for protection against geopolitical and policy uncertainty. Earlier in August, gold climbed above $4,600 per ounce to a three-month high, supported by a weaker dollar and shifting expectations for US interest rates.
Gold's backdrop nevertheless remains two-sided. Fed Chair Kevin Warsh's Jackson Hole remarks revived expectations that further monetary tightening may be necessary to contain inflation, while long-term Treasury yields remain elevated. At the same time, concerns about US fiscal policy and unusual volatility in long-duration Treasuries continue to support demand for alternative defensive assets such as gold.
Silver remains the standout precious metal on a longer-term basis. Its dual role as a precious and industrial metal leaves it particularly sensitive to both safe-haven demand and expectations for global manufacturing and technology investment.
Source: EquityRT Commodity Overview. Data as of 28/08/2026
Yield Curve Watch: Hawkish Fed Signals Flatten the 10Y–2Y Spread
The US Treasury curve sent a more mixed signal during the week, as renewed expectations for Federal Reserve tightening lifted short-term yields while longer-term borrowing costs remained elevated amid persistent fiscal and inflation concerns.
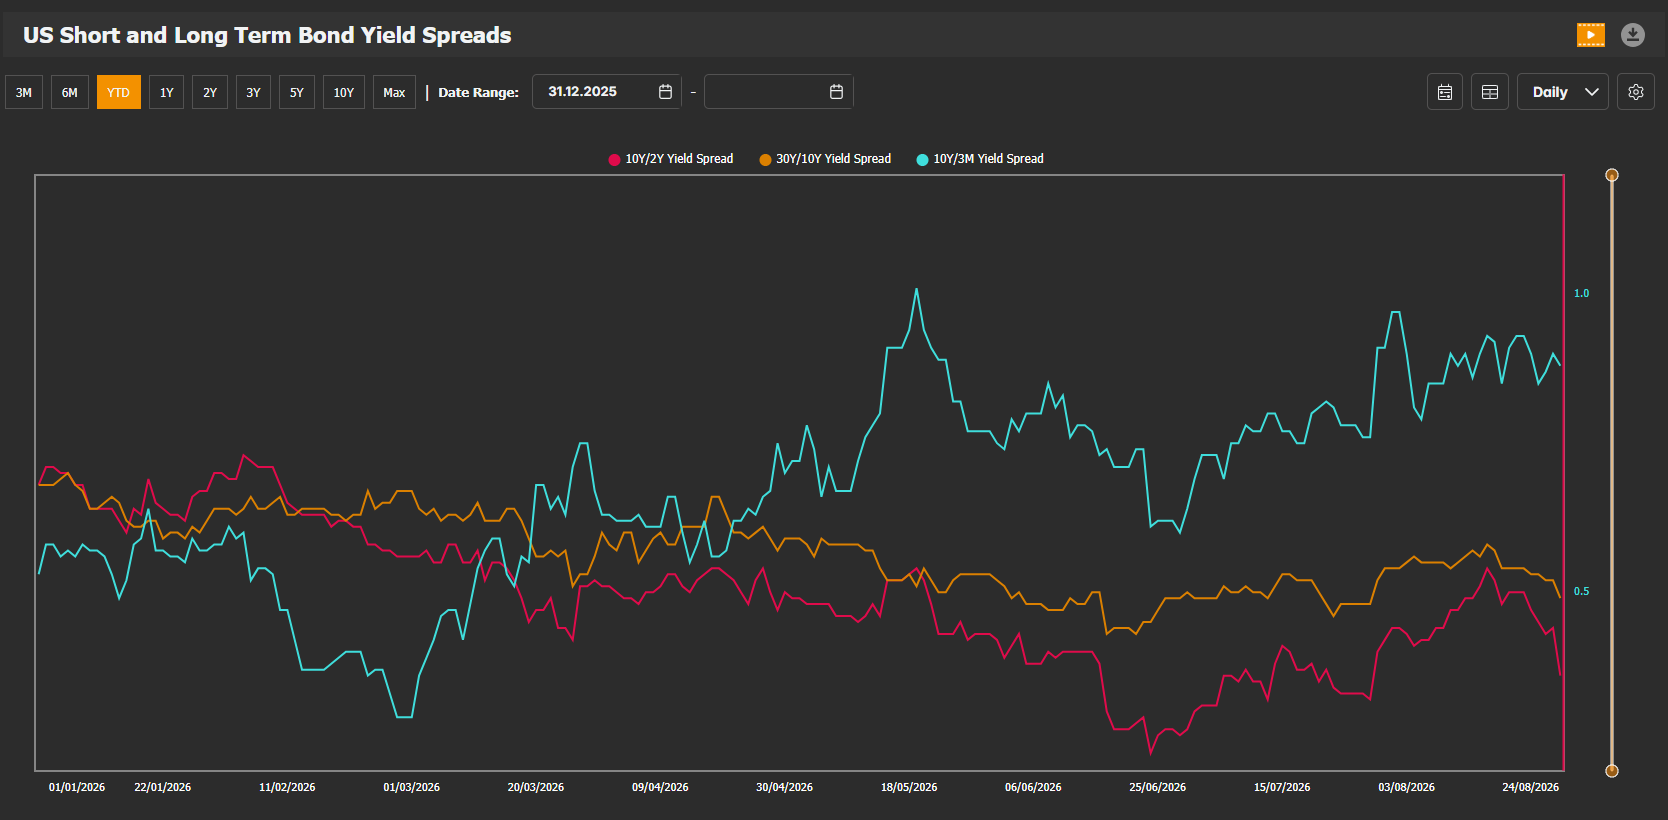
The most notable move came at the 10Y-2Y spread, which narrowed sharply toward the end of the week after having widened significantly through July and early August. Fed Chair Kevin Warsh's Jackson Hole remarks reinforced the Fed's commitment to returning inflation to its 2% target and raised expectations that another rate increase could come as soon as September. The 2-year Treasury yield jumped to around 4.36% on Friday, putting renewed pressure on the front end of the curve.
At the same time, the 10Y-3M spread remains close to the upper end of its 2026 range, at roughly 0.9%. This relatively steep spread continues to reflect the substantial gap that has developed between longer-term yields and the three-month rate as the curve has normalized during the year.
The 30Y-10Y spread remains around 0.5%, highlighting continued pressure at the long end. Earlier in August, the 30-year Treasury yield reached 5.34%, its highest level in 19 years, as investors demanded greater compensation for fiscal, inflation and geopolitical risks. Long-term borrowing costs have also risen across other major developed markets, indicating that the pressure is not unique to the US.
Fiscal concerns remain an important part of the long-end story. US public debt has surpassed $40 trillion, while rising deficits and heavy Treasury issuance have increased investor sensitivity to the supply of government bonds. In response to the recent surge in yields, the Treasury doubled planned buybacks of 10- to 30-year securities from $2 billion to at least $4 billion per operation. The intervention helped stabilize the market, but its relatively small scale means it does not resolve the underlying fiscal and supply concerns weighing on longer maturities.
Source: EquityRT ChartPro, Data as of 28/08/2026
Gold vs DXY: Hawkish Fed Message Interrupts Gold’s August Rally
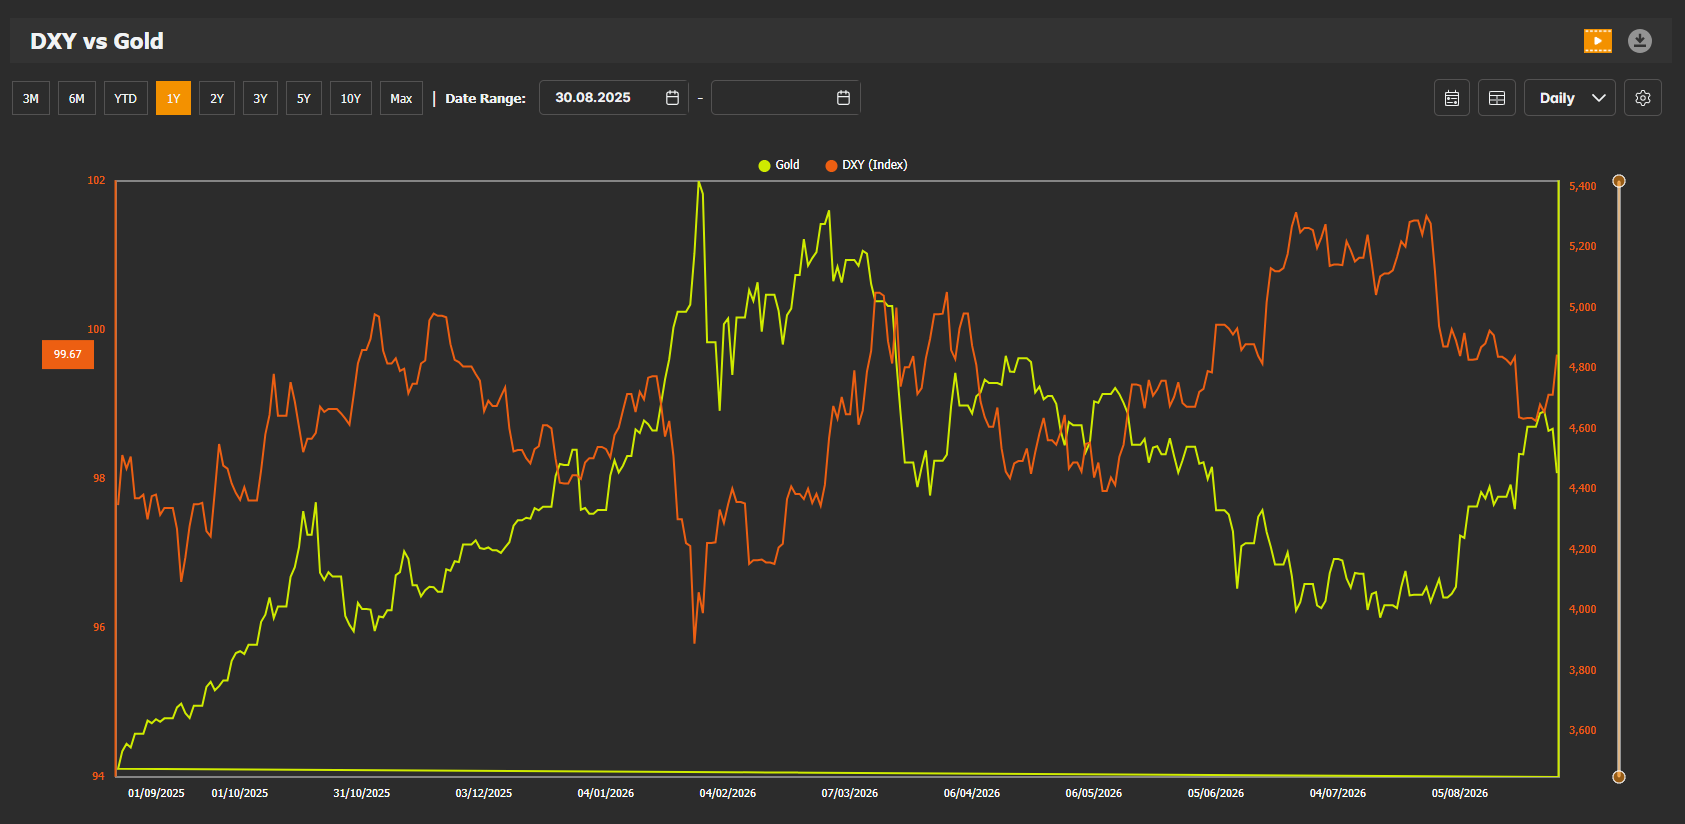
The inverse relationship between gold and the US dollar remained highly visible during the week, although Friday’s Jackson Hole speech triggered a sharp reversal in both markets.
Gold extended its August rally early in the week, reaching a more than three-month high as a softer dollar, US Treasury measures aimed at calming the long-term bond market and continued geopolitical uncertainty supported demand for bullion. The move built on gold’s strong recovery from its July lows and initially pushed prices above $4,600 per ounce.
The picture changed sharply on Friday. Gold fell more than 3% after Fed Chair Kevin Warsh struck a more hawkish tone at Jackson Hole, emphasizing that inflation remains too high and that further action could be required to restore price stability. Traders responded by increasing expectations for another Fed rate increase, pushing short-term Treasury yields and the dollar higher.
The US Dollar Index consequently recovered toward 100, reversing part of its earlier weakness. The reaction reinforces the relationship visible in the chart: gold has benefited when the dollar and US rate expectations have softened, but remains vulnerable when expectations for tighter monetary policy push yields and the dollar higher.
The week's US inflation data had already introduced some caution. July PCE inflation came in slightly firmer than expected on an annual basis, increasing market expectations for another rate hike even before Warsh's speech. Gold fell following the release as the dollar strengthened.
Source: EquityRT ChartPro, Data as of 28/08/2026
📈 Chart of the Week: Can a Cooling US Labor Market Justify Another Fed Hike?
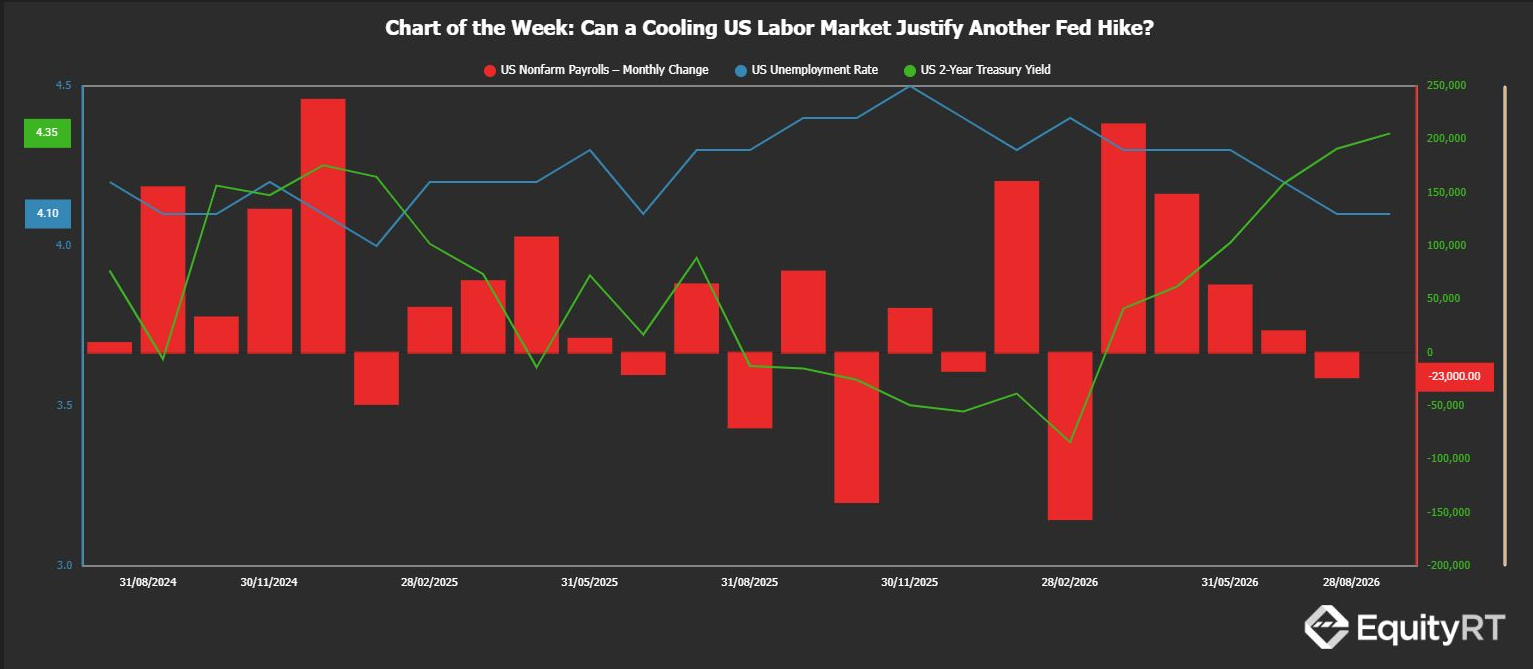
The Fed faces an increasingly difficult balancing act.
US payroll growth has weakened markedly, culminating in a 23,000 decline in July, while the unemployment rate remains around 4.1%. Yet the US 2-year Treasury yield, one of the market's clearest gauges of near-term monetary-policy expectations, has risen sharply as investors reassess the possibility of further Fed tightening.
This week's August employment report could therefore be pivotal. Another weak jobs reading would challenge the recent rise in rate expectations, while a stronger report could reinforce the case for keeping policy tighter for longer.
The question for markets: is the US labor market strong enough to withstand another rate hike?
Source: EquityRT | Data through 28 August 2026