

Market Focus: Fed Decision Takes Center Stage as Inflation Complicates the Policy Outlook
Global markets enter a new week with the Federal Reserve’s September policy decision, elevated inflation pressures and energy-market uncertainty firmly in focus.
Following stronger US employment data and hotter-than-expected August inflation, attention now shifts from whether the Fed has sufficient evidence to tighten to whether policymakers will actually deliver another rate increase. Core CPI rose 0.3% month-on-month in August, while headline inflation increased 0.4% and reached 3.4% year-on-year, strengthening market expectations for a 25-basis-point hike.
At the same time, energy markets remain an important part of the inflation outlook. The prospect of constructive discussions over tanker flows between Gulf countries and Iran has helped halt the recent surge in oil and gas prices, but uncertainty surrounding regional supply remains high. Any renewed move in energy prices could have implications for inflation expectations and global borrowing costs.
Beyond the Fed, monetary-policy decisions from the Bank of England and Bank of Japan will make this an unusually important week for global central banks. China’s August activity data and UK inflation and labor-market figures will provide further evidence on the global growth and price outlook.
US: Fed Faces a Critical Decision After Hotter Inflation
The Federal Reserve’s September meeting will be the main event, following a combination of resilient employment and firmer-than-expected inflation that has strengthened the case for additional tightening.
August headline CPI increased 0.4% month-on-month and 3.4% year-on-year, while core prices rose 0.3% on the month, exceeding expectations. Producer-price pressures also increased, adding to concerns that the disinflation process may be becoming less consistent.
Following Fed Chair Kevin Warsh’s hawkish Jackson Hole message, markets are now close to fully pricing a 25-basis-point rate increase, although some analysts remain skeptical that policymakers will ultimately hike. The decision and Warsh’s accompanying communication will therefore be crucial for determining whether the Fed views recent inflation pressures as sufficiently persistent to warrant another move.
Economic data will also remain important. August retail sales are expected to rebound 0.9% following July’s 0.6% decline, while industrial production is forecast to increase 0.3%. Import prices, housing starts, building permits and regional manufacturing surveys will provide additional evidence on the resilience of domestic demand and the impact of higher energy costs.
The combination of the Fed decision and incoming activity data will be particularly important for Treasury yields, the dollar and rate-sensitive equity valuations, following the recent repricing of the US interest-rate outlook.
Europe: BoE Holds as UK Inflation Moves Higher
Attention in Europe shifts from last week’s ECB meeting to the Bank of England, which is expected to leave its policy rate unchanged at 3.75%.
The decision comes against a challenging inflation backdrop. UK headline inflation is expected to accelerate to 3.1%, its highest level in five months, while core inflation is forecast to rise to 2.7%. At the same time, unemployment is expected to increase to 5% and wage growth to moderate, highlighting the tension between persistent price pressures and softer labor-market conditions.
Governor Andrew Bailey has pushed back against expectations of an imminent hike, suggesting that current market pricing incorporates a risk premium associated with the possibility of further energy-price increases. Markets nevertheless remain focused on whether persistent inflation could eventually force the BoE back toward tightening.
Elsewhere, Germany’s ZEW Economic Sentiment Indicator is expected to improve for a fifth consecutive month, while Euro Area industrial production is forecast to decline for the first time in six months. Final inflation readings across several major economies and Euro Area trade figures will provide additional signals on regional conditions.
Asia-Pacific: BoJ Decision and China Activity Data in Focus
Asia also faces a major monetary-policy test, with the Bank of Japan widely expected to raise its policy rate by 25 basis points to 1.25% amid persistent inflation pressures.
Japan will also publish August inflation and trade figures, while machinery orders will provide further evidence on domestic investment conditions. Core inflation is expected to remain at 1.8%, making the BoJ’s assessment of underlying price pressures particularly important for its forward guidance.
In China, attention turns to the August activity data, including industrial production, retail sales, fixed-asset investment, unemployment, house prices and credit aggregates. Industrial production is expected to accelerate modestly to 4.8%, while retail sales are forecast to rise only 0.8% and fixed-asset investment to contract further, highlighting continued unevenness in the recovery.
Elsewhere, India’s inflation data will be closely watched as higher food and fuel costs are expected to push consumer inflation higher. New Zealand will release Q2 GDP, while trade, inflation and producer-price data across the region will provide further signals on Asia-Pacific growth and inflation.
What Investors Should Watch
Will the Fed Deliver the Hike Markets Are Pricing?
Hotter inflation and resilient employment have strengthened the case for a September rate increase. The key question is whether the Fed follows through with a 25-basis-point hike and, just as importantly, whether its guidance suggests that further tightening could follow.
Are Global Central Banks Moving Back Toward Tightening?
With the Fed decision accompanied by meetings at the BoE and BoJ, markets will get an unusually broad assessment of the global policy outlook. Diverging decisions and guidance could have significant implications for currencies and sovereign yields.
Can Energy Prices Change the Inflation Outlook Again?
Prospects for dialogue over Persian Gulf tanker flows have interrupted the recent surge in oil and gas prices, but supply risks remain elevated. A sustained easing in energy prices could reduce pressure on central banks, while renewed disruption would complicate the inflation outlook just as policymakers reassess interest rates.
Global Equities: Stocks Rebound, but Inflation and Rising Yields Weigh on the Week
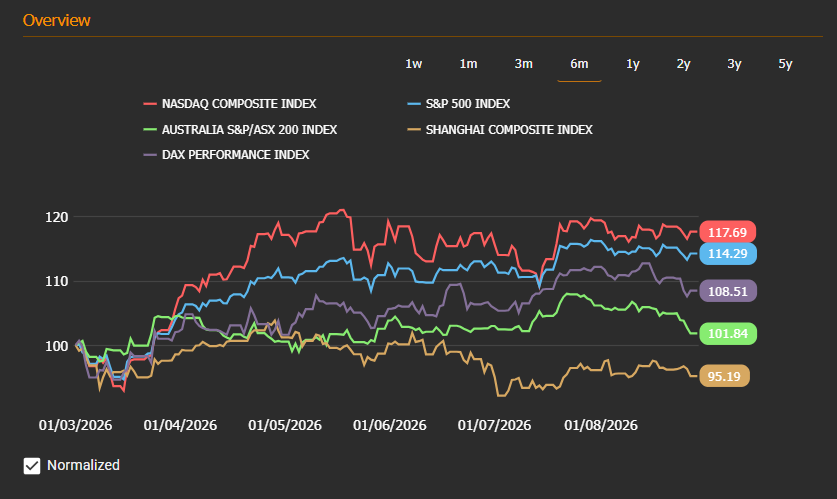
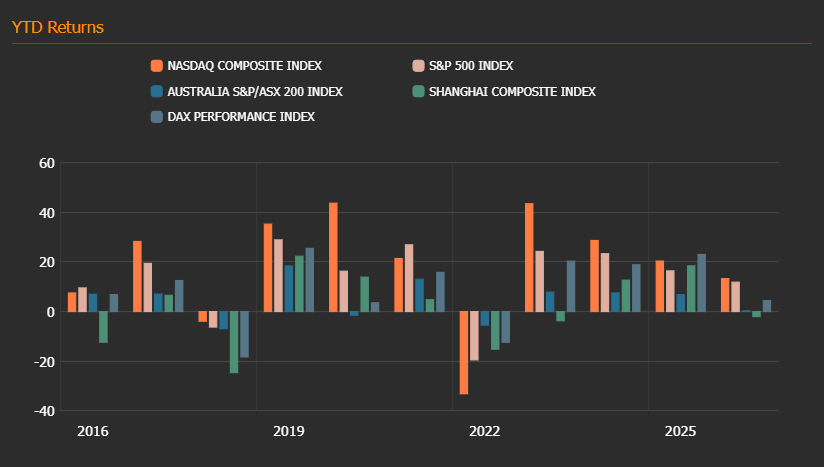
Global equity markets ended Friday on a firmer note, but the broader week remained challenging as surging energy prices, persistent inflation concerns and rising government bond yields weighed on risk appetite. US stocks rebounded after the August CPI report broadly matched expectations, while a pullback in oil prices provided some relief following a sharp energy-driven selloff earlier in the week.
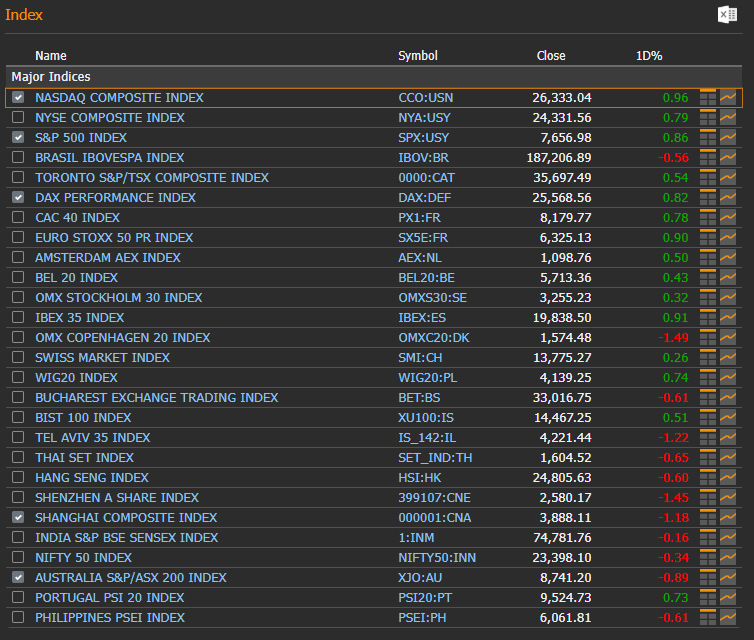
US equities rallied on Friday, with the Nasdaq Composite gaining 0.96% and the S&P 500 rising 0.86%.The rebound followed several weaker sessions as investors digested August inflation data and positioned for next week’s Federal Reserve meeting. Headline CPI rose 0.4% month-on-month and 3.4% year-on-year, while core prices increased 0.3% on the month, reinforcing expectations that the Fed could raise rates by 25 basis points.
The improvement on Friday did not fully reverse the week's earlier weakness. Oil prices had surged above $100 per barrel as Middle East tensions intensified, adding to inflation concerns and pushing Treasury yields sharply higher. The US 10-year yield approached 5%, increasing pressure on equity valuations, particularly in rate-sensitive growth sectors.
European equities also recovered on Friday but recorded a sharp weekly decline. The STOXX 600 gained around 0.5% in the final session. The DAX +0.82%, CAC 40 +0.78% and Euro STOXX 50 +0.90%.
Asian markets remained considerably weaker, particularly in China and Hong Kong.
Source: EquityRT Markets Overview. Data as of 11/09/2026
Commodity Markets: Oil Breaks Above $100 as Supply Risks Intensify
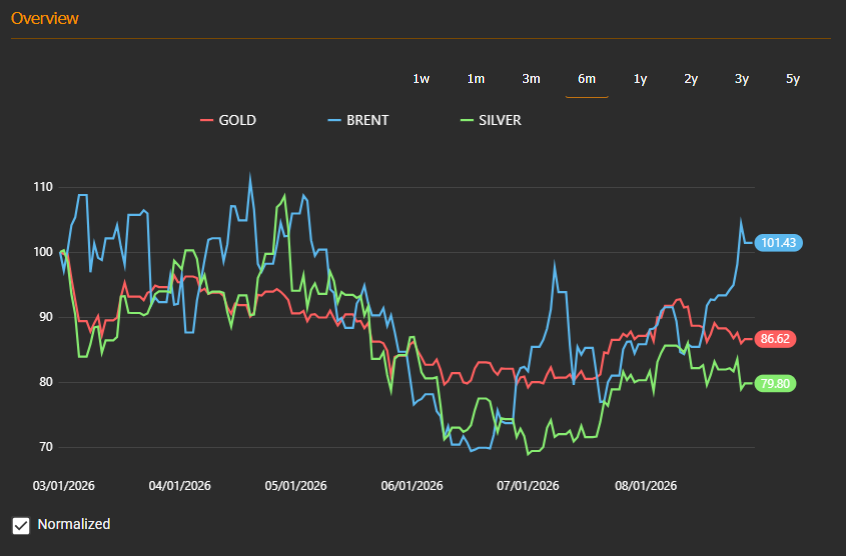
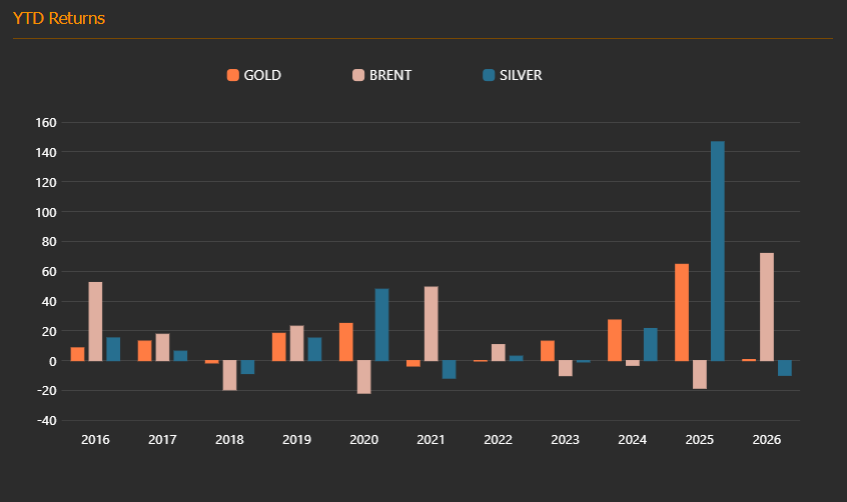
Commodity markets remained dominated by Middle East supply risks and rising inflation concerns, with oil extending its sharp advance while precious metals struggled under pressure from higher yields and expectations of tighter US monetary policy. Brent moved above $100 per barrel during the week as attacks on energy infrastructure and shipping routes intensified concerns over already-constrained Gulf supplies.
Brent crude gained more than 8% over the week and settled at $104.61 per barrel on Friday, despite retreating in the final session as prospects for diplomatic discussions with Iran offered some relief. Disruptions to tanker traffic through the Strait of Hormuz, attacks on shipping routes and damage to Saudi energy infrastructure tightened an already fragile supply picture. The IEA also warned that global oil supply could fall by 5.7 million barrels per day in 2026 if normal Gulf flows remain delayed.
Gold, meanwhile, headed for a third consecutive weekly decline, as rising Treasury yields and expectations of another Federal Reserve rate increase outweighed the traditional safe-haven support from geopolitical uncertainty. Bullion recovered by more than 1% on Friday following recent losses, but hotter August US inflation lifted the market-implied probability of a September Fed hike to around 87%, maintaining pressure on the non-yielding metal.
Silver followed gold lower over the week, with precious metals broadly pressured by the increasingly hawkish US rate outlook. While geopolitical uncertainty continues to provide some underlying support, the near-term direction of both gold and silver remains closely linked to Treasury yields, the dollar and expectations for the Fed's next move.
Source: EquityRT Commodity Overview. Data as of 11/09/2026
Yield Curve Watch: 10-Year Yield Tests 5% as Inflation Fears Intensify
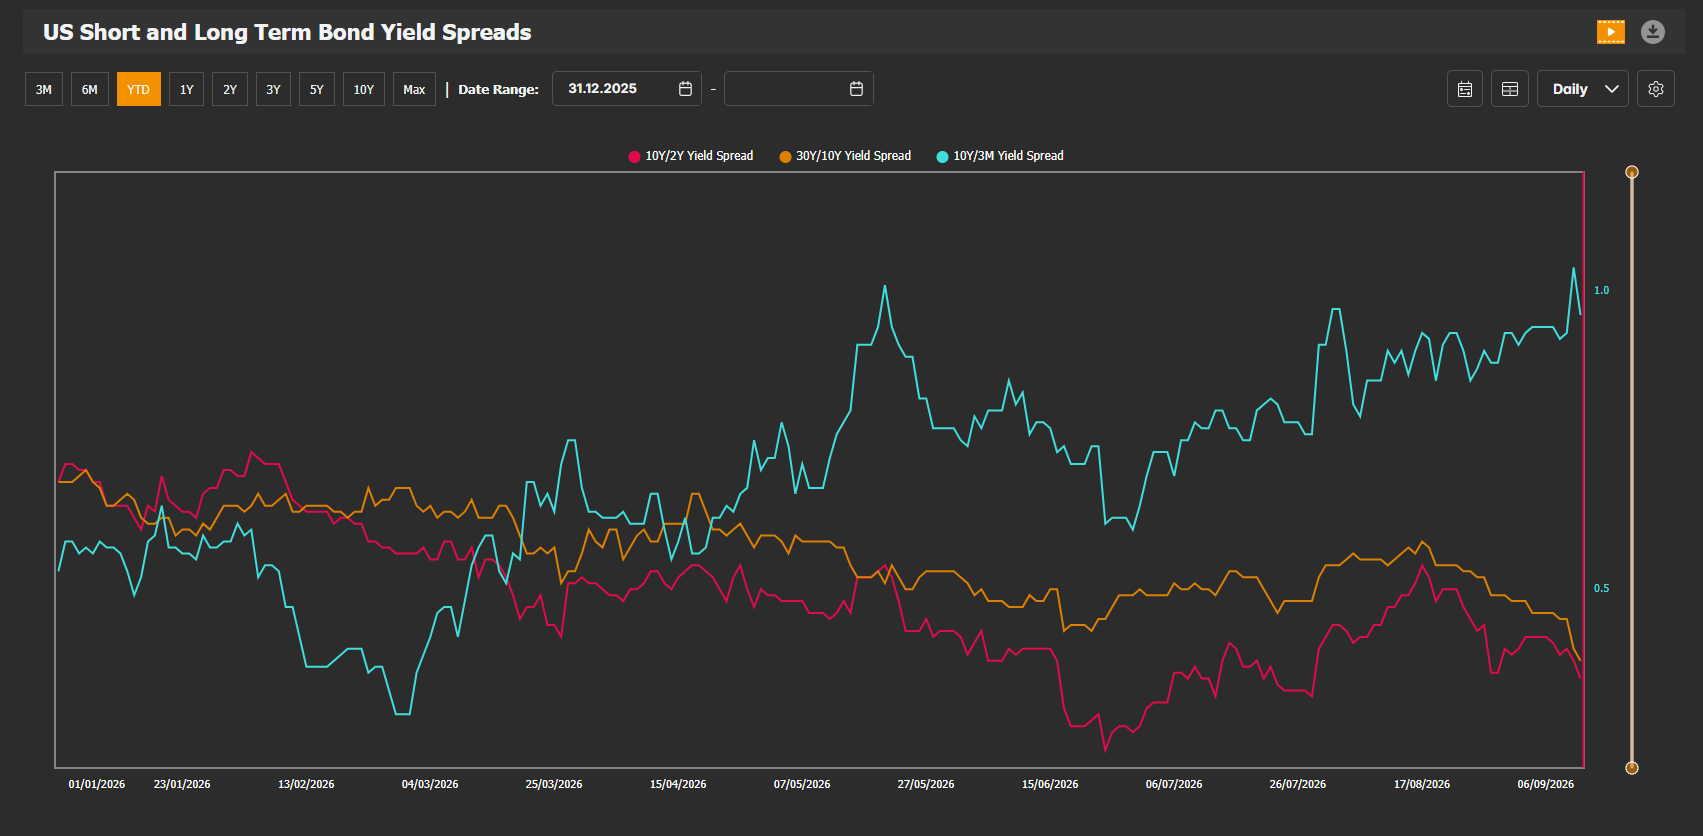
US Treasury yields rose sharply during the week as higher energy prices, persistent inflation concerns and growing expectations of a near-term Federal Reserve rate hike drove a broader global bond selloff. The benchmark 10-year Treasury yield reached as high as 4.979% on Friday, its highest level since late 2023, before easing to around 4.93% after August CPI came broadly in line with expectations.
The 10Y-2Y spread has narrowed to around 0.35 percentage points. The renewed flattening reflects stronger upward pressure on shorter-term yields as markets have repriced the near-term Fed outlook. August headline CPI increased 0.4% month-on-month and 3.4% year-on-year, while core CPI rose 0.3% on the month. Following the report, markets assigned roughly an 85% probability to a 25-basis-point Fed hike at the September 15–16 meeting.
At the same time, the 10Y-3M spread has widened to around 1.0 percentage point, near the upper end of its 2026 range. This reflects the sharp rise in longer-term borrowing costs relative to the three-month rate. The move has been reinforced by oil prices above $100, which have revived concerns that energy costs could prolong inflation pressures and complicate the Fed's path toward price stability.
The 30Y-10Y spread has also narrowed, toward roughly 0.35–0.40 percentage points, even as absolute long-term yields remain exceptionally elevated. The 30-year Treasury yield reached around 5.38% during the week, its highest level since 2007. Heavy government borrowing, large fiscal deficits and persistent inflation risk continue to demand a higher term premium from investors
Source: EquityRT ChartPro, Data as of 11/09/2026
Gold vs DXY: Inflation and Fed Hike Bets Keep Gold Under Pressure
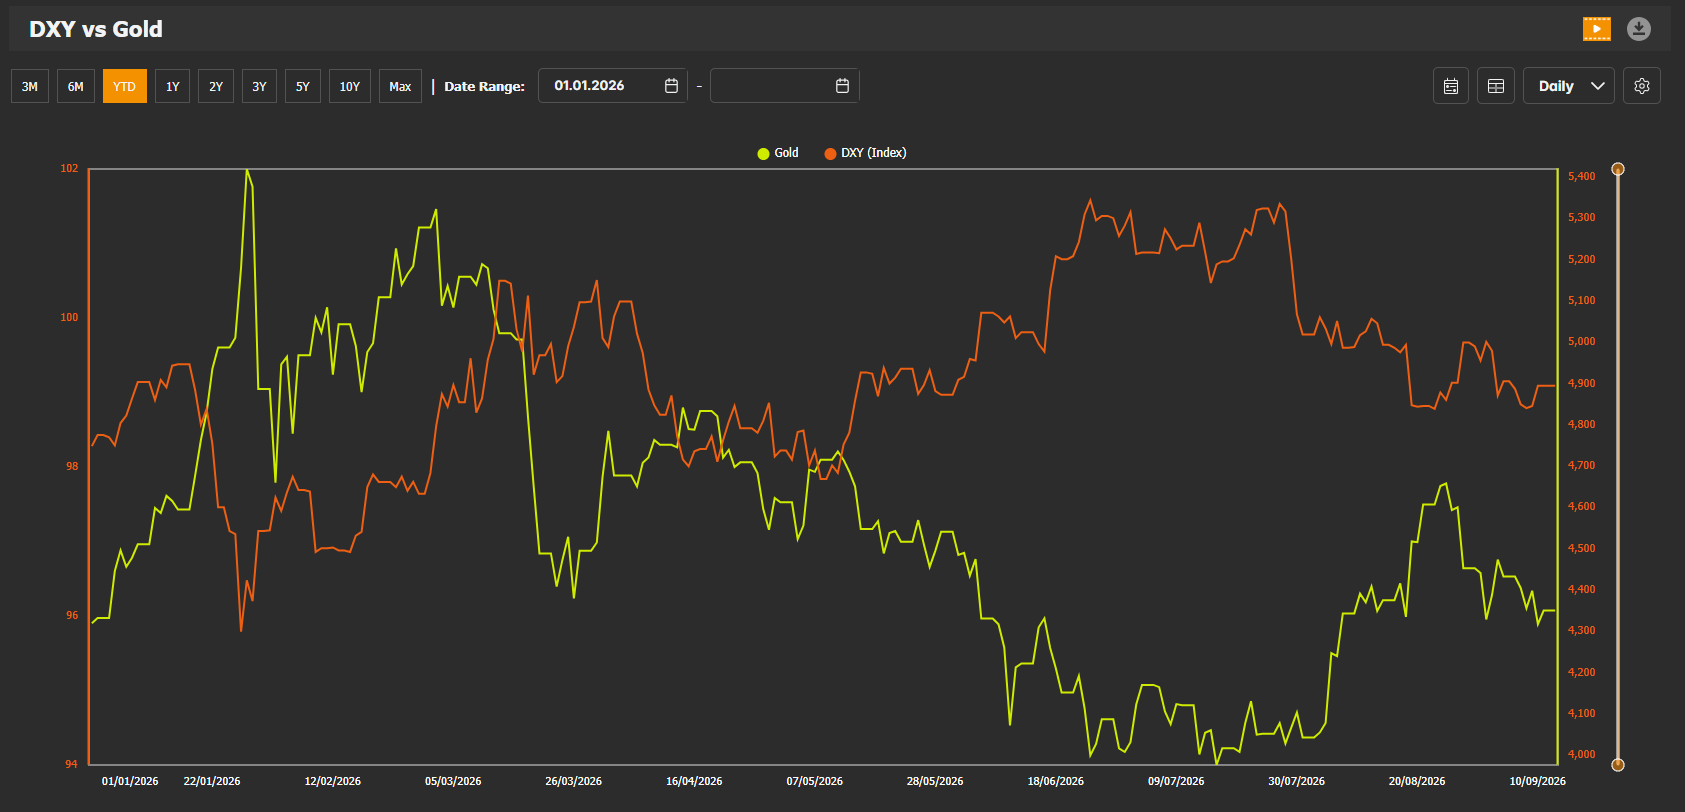
Gold remained under pressure during the week as firmer US inflation reinforced expectations for another Federal Reserve rate increase, while the dollar remained relatively resilient. The relationship between the two assets has become particularly visible in recent months, with gold struggling as higher US yields and tighter monetary-policy expectations increased the opportunity cost of holding the non-yielding metal.
Source: EquityRT ChartPro, Data as of 11/09/2026
📈 Chart of the Week: Will the Fed Deliver the Hike Markets Are Pricing?
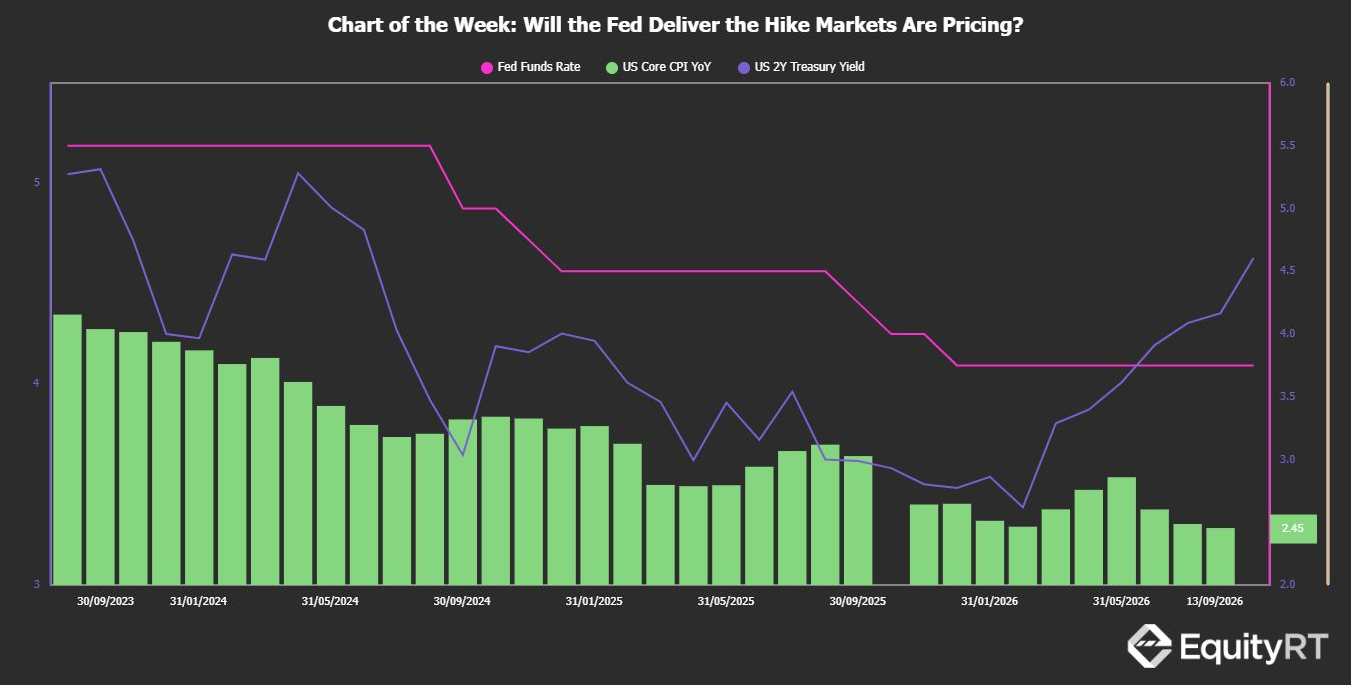
Markets have sharply repriced expectations for the September Fed meeting following stronger employment data and hotter August inflation. The US 2-year Treasury yield has moved above the current Fed Funds Rate as investors increasingly anticipate another rate hike. Wednesday’s decision will show whether the Fed validates that market repricing.
What do you expect from the Fed at its September meeting?
Source: EquityRT | Data 11/09/2026