

Market Focus: Flash PMIs, China’s Growth and AI Earnings Under Scrutiny
Global markets enter October 19-25 after a technology-led equity selloff, stronger US inflation readings and continued uncertainty over energy supplies. Flash October business surveys, China’s third-quarter growth figures and a new wave of corporate earnings will test the resilience of global activity.
In the United States, flash S&P Global Manufacturing and Services PMIs, housing indicators and the final University of Michigan Consumer Sentiment Index will provide timely evidence on demand and inflation expectations. The Federal Reserve enters its pre-meeting communications blackout ahead of the October 28 decision.
China’s third-quarter GDP growth exceeded expectations, supported by resilient industrial production, while subdued retail sales highlighted persistent weakness in domestic demand. Across Europe, preliminary PMIs, UK inflation and labor-market releases, and Turkiye’s interest-rate decision will shape the macroeconomic outlook.
Energy-market disruptions and the cost of financing AI infrastructure remain central risks. Investors will also examine corporate earnings for evidence that investment spending is translating into sustainable revenue and profits.
Results from Meta, Tesla, Netflix, Texas Instruments, SAP and other major companies will provide a cross-sector view of technology investment, consumer demand and corporate margins.
U.S. Activity, Housing and AI Earnings Face a Critical Test
The flash October S&P Global Manufacturing PMI and Services PMI will offer an early indication of whether US business activity is maintaining momentum as inflation and borrowing costs remain elevated.
The final University of Michigan Consumer Sentiment Index will provide insight into household confidence and inflation expectations. The Conference Board Leading Economic Index and Kansas City Fed Manufacturing Index will offer additional signals on economic momentum.
Housing will be another important focus, with the NAHB Housing Market Index, Building Permits, Housing Starts and Pending Home Sales offering a gauge of interest-rate sensitivity and residential demand.
The Federal Reserve will observe its communications blackout ahead of the October 28 FOMC decision. As a result, the week’s economic releases and corporate results will carry greater weight in assessing underlying conditions.
Corporate earnings are due from Meta, Tesla, Netflix, Texas Instruments, IBM, Procter & Gamble, GE Aerospace, General Motors, 3M, Honeywell and American Express. Investors will focus on AI investment returns, financing costs, consumer resilience and margins.
In Canada, September CPI, producer prices and retail sales are scheduled. Mexico and Brazil will release mid-month inflation readings, offering further insight into regional price pressures.
The combined indicators will help distinguish between a moderate slowdown in demand and more persistent inflation pressures across the Americas.
European PMIs and UK Inflation Take Focus
Flash October Manufacturing and Services PMIs will provide an early assessment of Euro Area growth. Both sectors are expected to remain in expansion, although momentum may ease from September.
Germany’s manufacturing activity is expected to remain positive, while services may strengthen. The ZEW Economic Sentiment Index for Germany and the Euro Area, alongside Eurozone Consumer Confidence, will show whether expectations are keeping pace with activity.
The UK faces a busy calendar featuring CPI, labor-market indicators and Retail Sales. Annual headline inflation is expected to reach 3.4%, while the unemployment rate is forecast near 5%, highlighting the tension between price pressures and softer employment.
German producer prices, Euro Area car registrations and Switzerland’s trade balance are also due.
Corporate updates from SAP, ABB, Nestlé, L’Oréal, Hermès and EssilorLuxottica will add evidence on European demand, industrial activity and consumer spending.
China’s Q3 Growth and Asia-Pacific Inflation in the Spotlight
China’s economy expanded by 4.5% year-on-year in the third quarter, accelerating from 4.3% in Q2 and exceeding market expectations. September industrial production rose 5.5%, supported by strong exports and high-tech manufacturing, while retail sales increased by just 1.1%, highlighting the continued imbalance between industrial strength and subdued domestic consumption.
The People’s Bank of China’s policy settings will also be monitored for signs of additional support as policymakers balance growth and financial stability.
Japan’s inflation and trade figures, together with flash PMI readings, will help gauge domestic price pressures and external demand. Regional central-bank decisions and inflation releases will provide further policy signals.
Australia and India will publish preliminary PMI readings. Across Asia-Pacific, economic releases will help distinguish resilient manufacturing activity from softer domestic consumption.
Other regional indicators include inflation and trade data from Southeast Asian economies and policy developments in Japan and neighboring markets.
The regional data will be important for assessing whether Asia’s growth remains resilient amid higher energy costs and more cautious global risk appetite.
What Investors Should Watch
1. Will Flash PMIs Confirm Resilient Growth?
October flash PMIs in the US, Euro Area and Asia will provide an early view of activity amid higher financing and energy costs. The balance between manufacturing and services will be particularly informative.
2. Can Technology Earnings Support AI Investment Expectations?
Results from Meta, Tesla, Texas Instruments and other large companies will test whether AI infrastructure spending is being matched by revenue growth and sustainable returns.
3. Is China’s Recovery Broadening Beyond Exports?
China’s Q3 GDP, industrial production and retail sales will show whether domestic demand is strengthening or whether growth remains uneven.
4. Will Inflation Keep Central Banks Cautious?
UK inflation, Canada CPI, and regional price data will help assess the persistence of inflation and the scope for monetary-policy adjustments.
Global Equities: Tech-Led Selling Masks Diverging Regional Performance
Global equities ended the week of October 16 with sharply divergent performance. US technology shares came under pressure as investors reassessed AI-related financing costs and the sustainability of infrastructure spending, while some defensive sectors and overseas markets proved more resilient.
The Nasdaq Composite pointed 26,140.03, down 2.14% on the session, and the S&P 500 at 7,659.44, down 1.09%. The NYSE Composite edged up 0.09%, highlighting a difference between technology-heavy benchmarks and the broader market.
The weekly picture was weaker still: A 4.5% decline was reported for the Nasdaq and a 1.9% loss for the S&P 500, while the Dow Jones Industrial Average* rose 0.7%.
Europe was comparatively resilient. The DAX rose 0.95%, the CAC 40 gained 0.28% and the Euro Stoxx 50 advanced 0.58%. In Asia, the Hang Seng rose 0.52% and the Shanghai Composite added 0.24%, while Australia’s ASX 200 gained 1.00%.
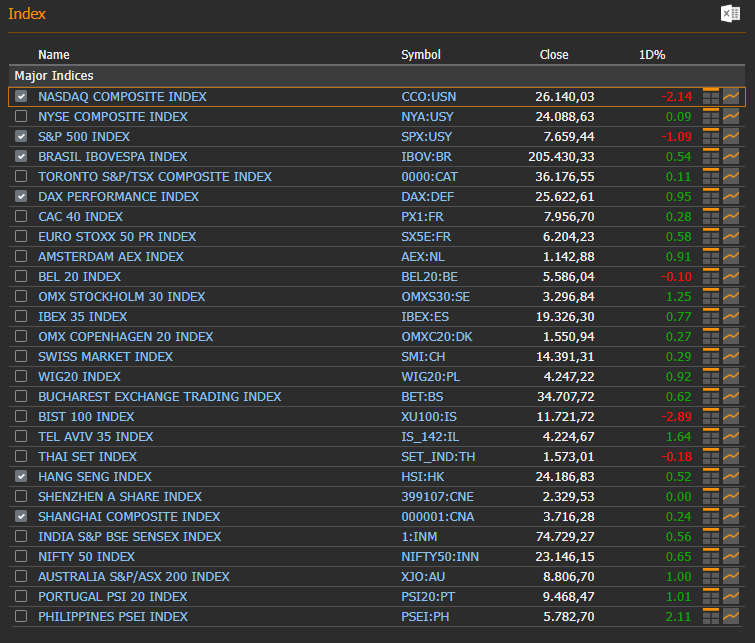
*The Dow quoted is the standard price-weighted index; it should not be confused with any equal-weighted Dow series.
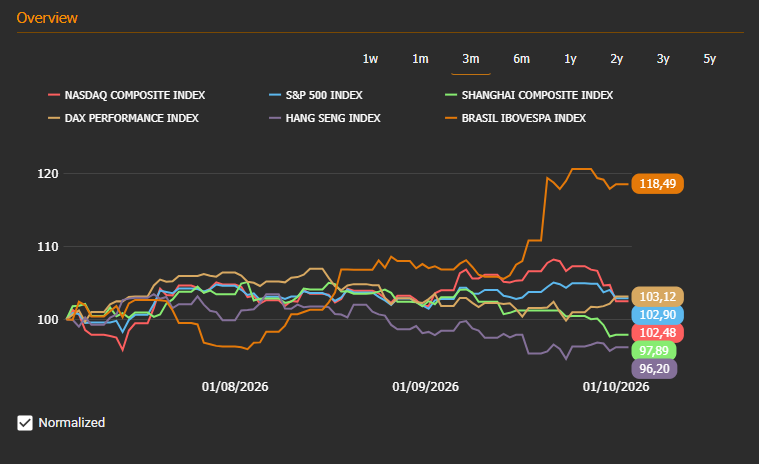
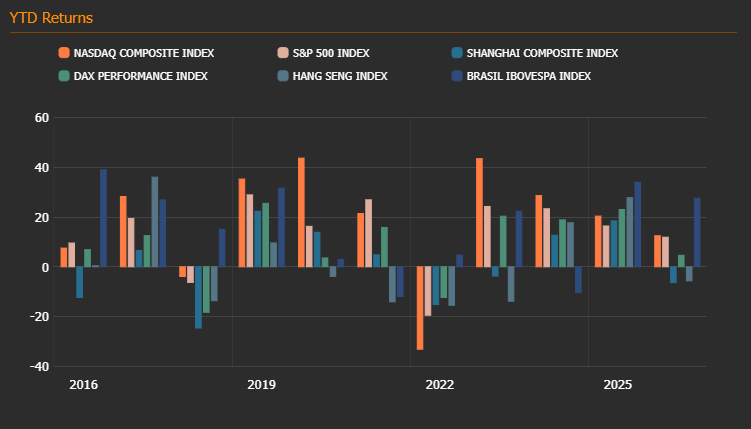
Source: EquityRT Markets Overview. Data as of 16/10/2026
Commodity Markets: Oil Supply Risks Persist as Precious Metals Face Rate Pressure
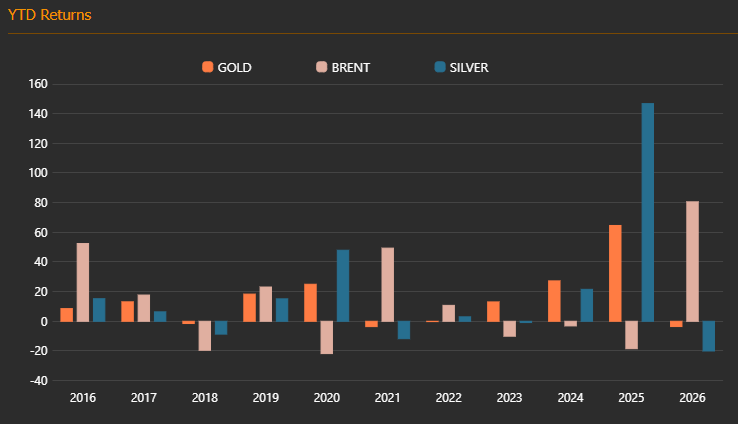
Commodity markets remained sensitive to geopolitical developments and US monetary-policy expectations during the week ending October 16, 2026. Brent crude continued to trade above $100 a barrel, with renewed Middle East supply concerns keeping energy-related inflation risks in focus.
Precious metals faced a more challenging week. Gold was on course for a weekly decline of around 0.7%, while silver also fell approximately 0.7% over the week. Gold rebounded at points as the dollar and Treasury yields retreated, but stronger US inflation readings reinforced uncertainty over the Federal Reserve’s policy path.
The divergence between firm energy prices and softer precious metals highlight competing macro forces: oil supply risks can lift inflation expectations, while high real and nominal borrowing costs increase the opportunity cost of holding non-yielding metals.
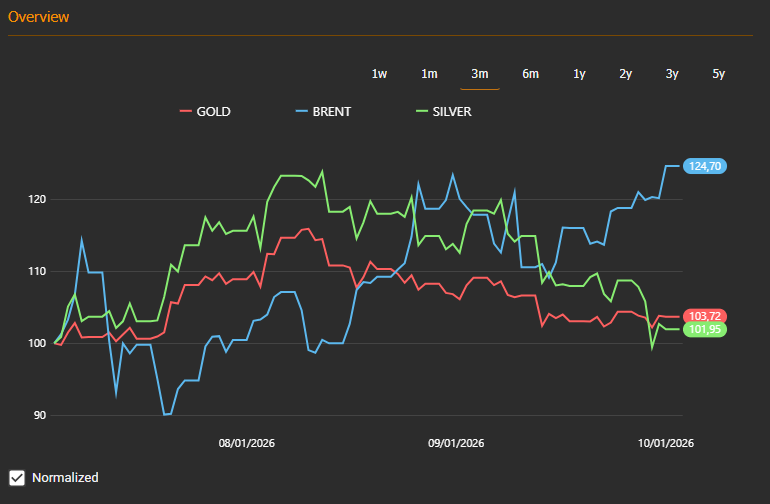
Source: EquityRT Commodity Overview. Data as of 16/10/2026
U.S. Yield Curve: Weekly Relief, but Borrowing Costs Remain Elevated
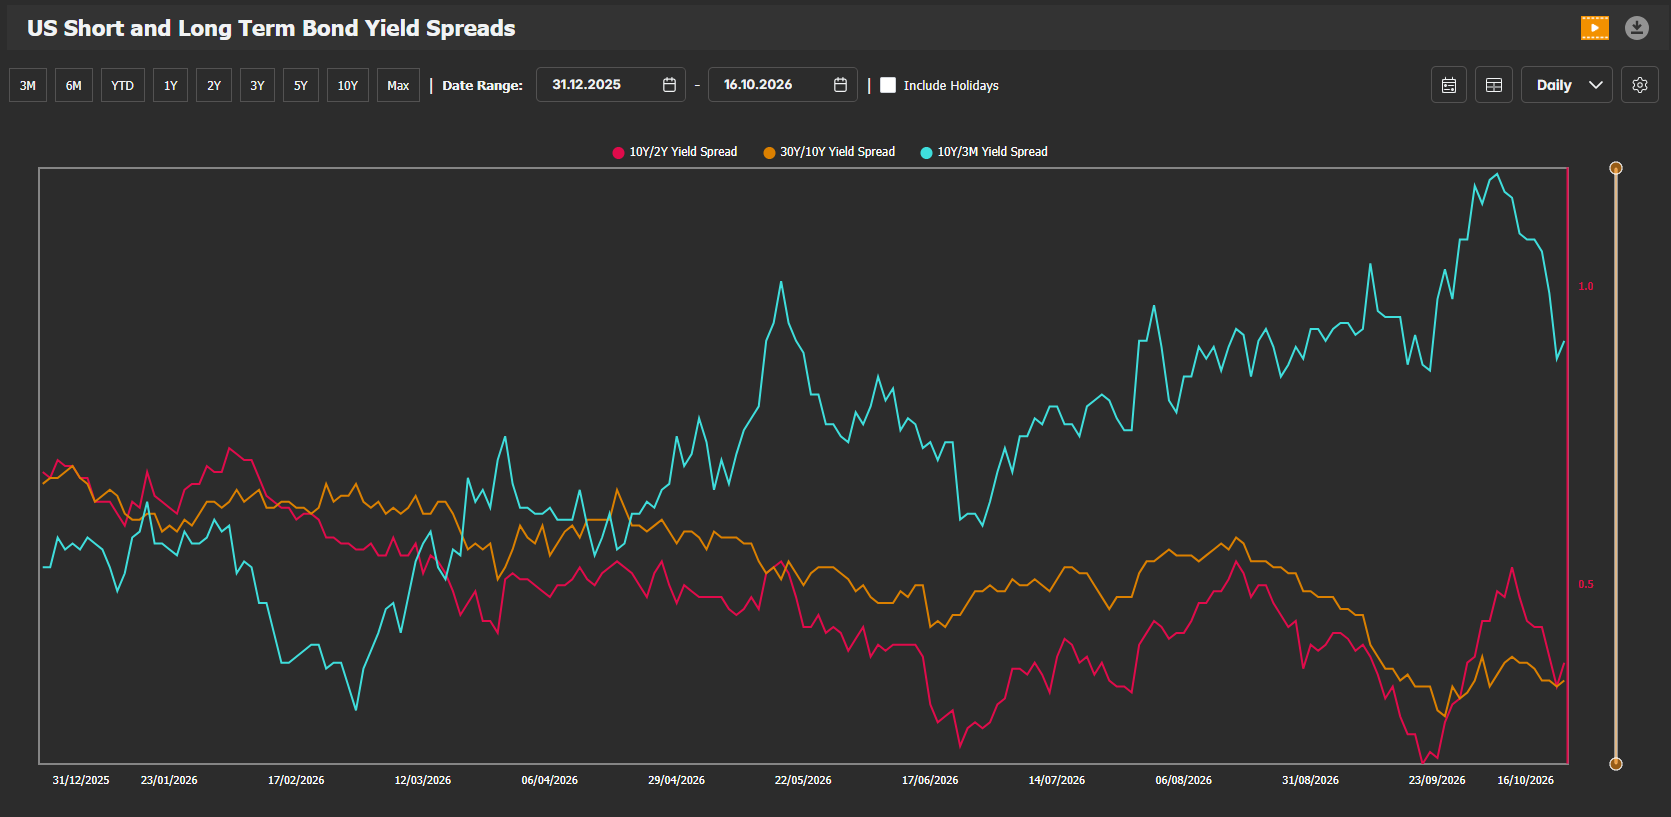
US Treasury yields eased during the week ending October 16, 2026, following an extended period of volatility driven by inflation, energy prices and expectations for Federal Reserve policy. The benchmark 10-year yield ended near 5.10%, while the 2-year yield was around 4.73%, according to financial-market reporting. The 30-year yield ended near 5.44%.
These levels imply a positive 10-year minus 2-year spread of approximately 36 basis points and a 30-year minus 10-year spread of approximately 34 basis points. The curve therefore remained upward sloping even as yields declined during the week. A positive spread should not, by itself, be interpreted as proof that term premiums or inflation expectations rose; both the expected policy path and term premiums affect longer-maturity yields.
For the macro outlook, the key issue is that financing conditions remain restrictive despite the weekly pullback. Sustained high long-term yields can weigh on housing, investment and debt-service costs.
Source: EquityRT ChartPro, Data as of 16/10/2026
Gold vs. DXY: Inflation and Yield Shifts Complicate the Relationship
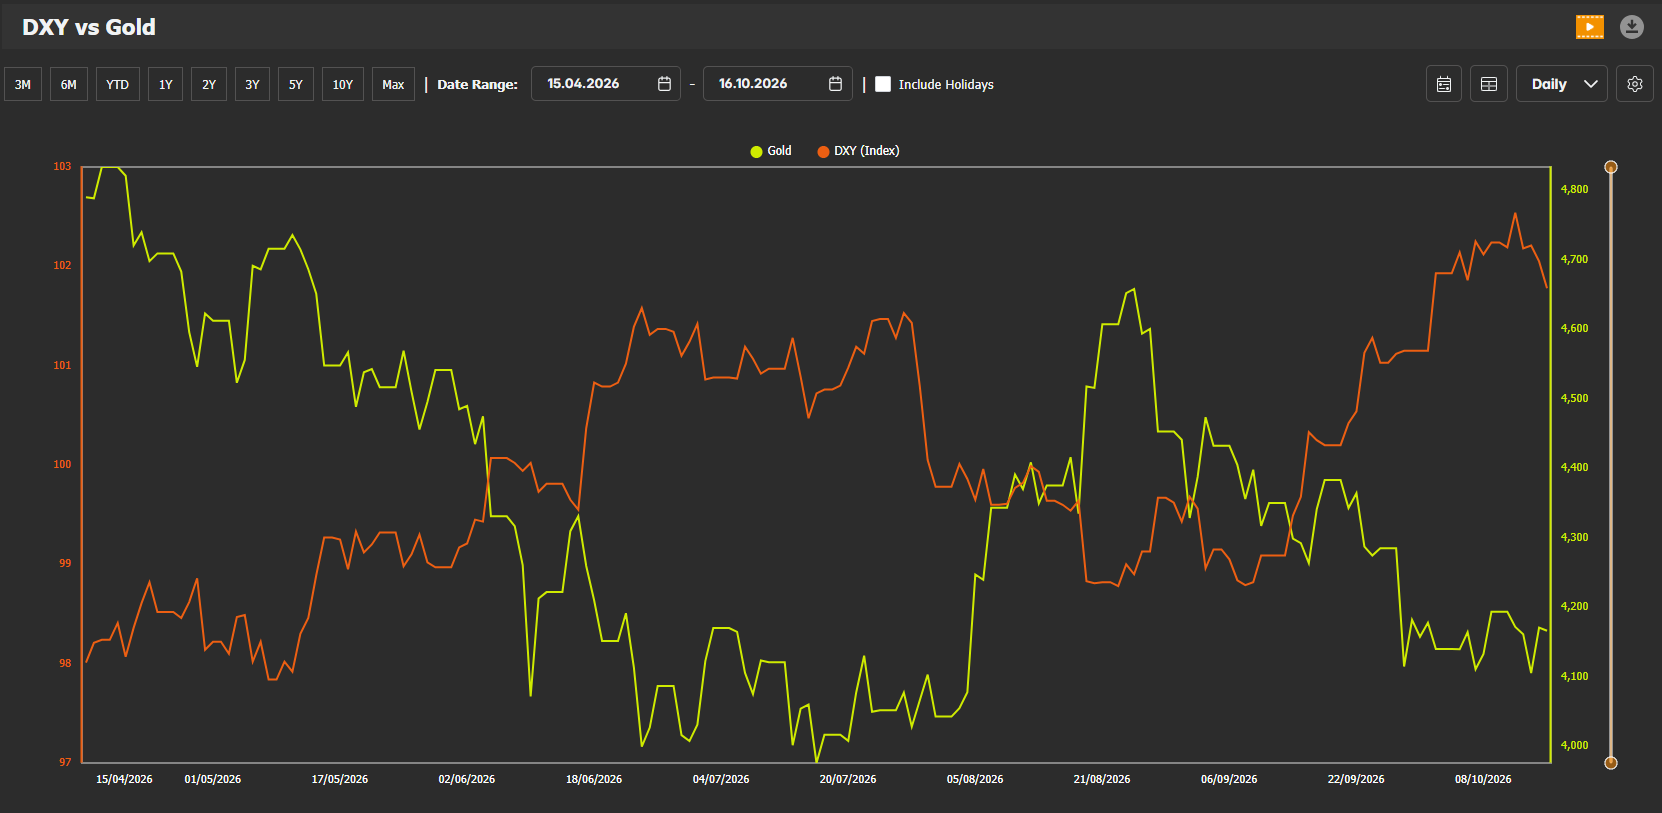
The dollar and gold responded unevenly to inflation news and shifts in US Treasury yields during the week ending October 16, 2026. Stronger-than-expected September US inflation data initially supported the dollar and yields and pressured bullion, while a subsequent retreat in both helped gold recover on Thursday.
Despite that rebound, gold was set for a weekly loss of approximately 0.7%. The dollar’s strength and elevated yields remained important constraints, but gold also reflected geopolitical uncertainty and demand for defensive assets.
Source: EquityRT ChartPro, Data as of 16/10/2026
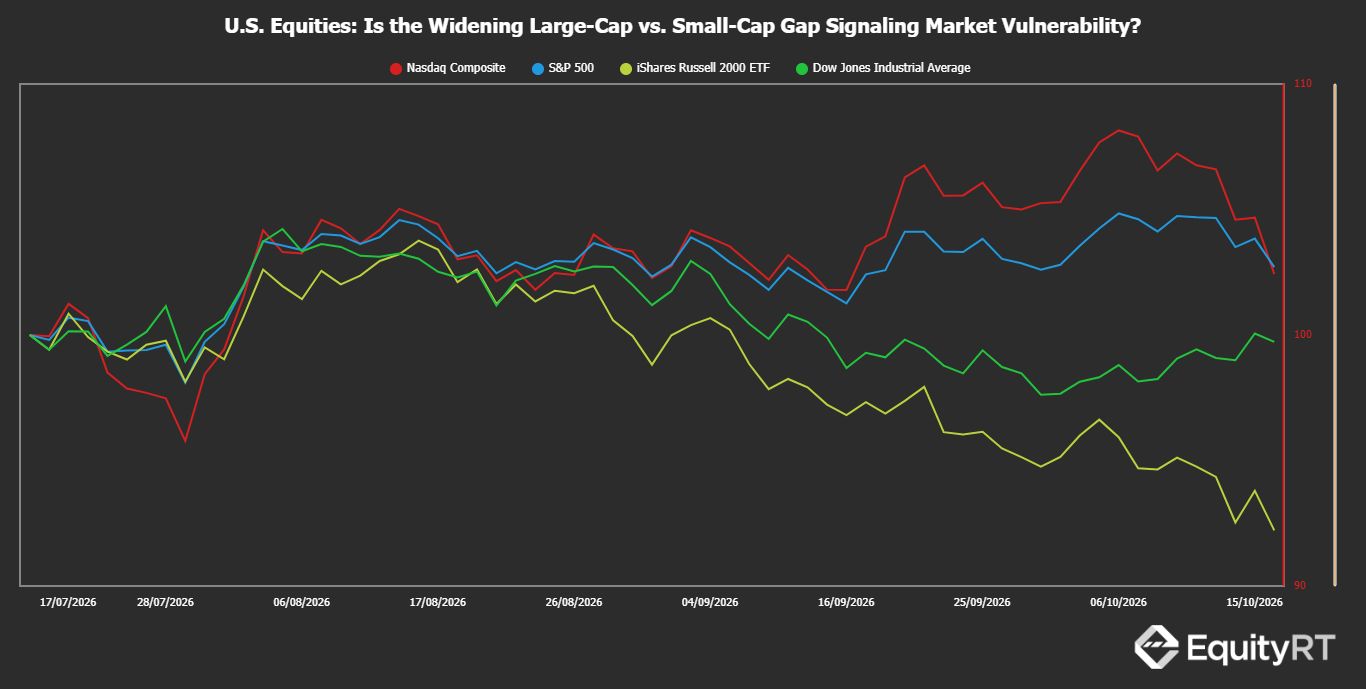
📈 Chart of the Week: U.S. Equities: Is the Widening Large-Cap vs. Small-Cap Gap Signaling Market Vulnerability?
U.S. equity markets are showing signs of a shift in leadership as concerns over AI investment costs and profitability weigh on technology-heavy indices. While the Nasdaq Composite and market-cap-weighted S&P 500 have faced selling pressure, the relative resilience of equally weighted stocks suggests that investors may be rotating toward other sectors rather than withdrawing from equities altogether.
The divergence highlights an important change in market dynamics: after a prolonged period of mega-cap technology leadership, broader market participation may be improving even as headline indices weaken.
With another round of major technology earnings approaching, the key question is whether corporate results can restore confidence in AI-related valuations or accelerate the rotation toward other areas of the market.
Source: EquityRT | Data as of 16/10/2026