

Market Focus: US Inflation, AI Valuations and Global Growth in Focus
Global markets enter November 9-15 after a volatile week for technology shares, with investors weighing elevated AI valuations against resilient US employment and renewed uncertainty over the Federal Reserve’s policy path. October consumer and producer inflation figures will be the principal US economic figures, while China’s prices and trade data and UK growth releases will offer a broader test of global demand.
The stronger-than-expected October US employment report reinforced expectations that the Federal Reserve could maintain a restrictive policy stance. Inflation readings will now determine whether easing monthly price pressures are sufficient to counter concerns about persistent underlying inflation and energy costs.
The US midterm election outcome has prompted a reassessment of fiscal, regulatory and trade-policy prospects. Investors will also monitor remarks from Federal Reserve officials for guidance on the December meeting, alongside renewed debate over the profitability and financing of AI infrastructure.
Energy markets remain exposed to Middle East supply risks, although expectations of diplomatic progress contributed to a retreat in oil prices during the latest trading week. Gold recovered strongly over the week despite a Friday pullback as a stronger dollar and higher Treasury yields followed the employment report.
Quarterly results from Cisco, Applied Materials, CoreWeave, Occidental Petroleum and other companies will provide further insight into technology investment, energy-sector profitability and corporate spending.
U.S.: October CPI and PPI to Test December Fed Expectations
US inflation will take center stage this week. October CPI is scheduled for Tuesday, November 10, followed by producer prices on Friday, November 13. The releases will help determine whether energy-related price pressures are spilling over into broader consumer and business costs.
Headline CPI is expected to rise 0.3% month on month, compared with 0.6% in September, while core CPI is forecast to increase 0.2%, versus 0.3% previously. Headline PPI is expected to rise 0.4% and core PPI 0.3%; these are forecasts, not reported outcomes.
Federal Reserve officials are scheduled to speak during the week. Their comments will be assessed in light of October payroll growth of 165,000 and an unemployment rate of 4.1%, both of which strengthened expectations that the central bank may tighten policy again in December.
Other releases include the NFIB Small Business Optimism Index, wholesale inventories, the federal budget statement and housing indicators. The US bond market will observe Veterans Day on Wednesday, November 11, although equity trading is expected to continue.
Corporate earnings from Cisco Systems, Applied Materials, CoreWeave, Occidental Petroleum, Barrick Mining and Nebius Group will test demand across technology, infrastructure, commodities and energy. Investors will look closely at margins, financing costs and forward guidance.
Elsewhere in the Americas, Mexico and Brazil will release October inflation data. Brazil will also publish monetary-policy minutes, retail sales and business confidence figures, providing further evidence on regional price pressures and demand.
Together, inflation reports, Fed commentary and earnings guidance will help markets reassess the balance between resilient activity and the risk of further monetary tightening.
Europe: UK Third-Quarter GDP and Euro Area Activity Under Review
The United Kingdom will publish preliminary third-quarter GDP, September monthly GDP, industrial and manufacturing output, and trade figures. Quarterly growth is expected to reach 0.7%, while September monthly output is forecast to stagnate; both remain estimates ahead of publication.
The euro area will release an updated estimate of third-quarter GDP alongside preliminary employment figures and September trade data. The combination will help assess whether modest growth is translating into sustained labor-market resilience.
German trade figures, wholesale prices and final inflation readings across several European economies will provide additional evidence on demand and pricing. Poland and Russia are also scheduled to publish third-quarter GDP, while Russian inflation will remain in focus.
Across Europe, elevated financing costs and energy prices continue to complicate the outlook.
Corporate results from Siemens, Siemens Energy, Allianz, Enel, Infineon and Munich Re will add insight into industrial orders, infrastructure investment, insurance and corporate profitability.
Asia-Pacific: China Inflation and Trade, Japan Prices in Focus
China’s October producer prices rose 5.7% year-on-year, accelerating from 5.0% in September and exceeding market expectations of 5.3%. The increase marked the fastest pace since June 2022, driven by stronger commodity prices and improving industrial demand. The figures highlight rising input costs, while the broader inflation outlook will depend on whether higher producer prices translate into stronger consumer inflation amid still-subdued household demand.
China’s October trade balance is due Tuesday, November 10. The trade surplus is expected to remain substantial, supported by external demand for technology-related products, even as the domestic recovery remains uneven. New lending and credit figures will provide further clues on policy transmission.
Japan will release producer-price figures, household spending and current-account data, alongside the Bank of Japan’s summary of opinions from its latest policy meeting. These releases will help gauge the persistence of inflation and the prospects for further policy adjustment.
India’s October inflation release will provide a further test of regional price pressures. In Australia, consumer and business confidence, housing finance and inflation expectations will help clarify the outlook after recent monetary-policy tightening.
GDP figures from the Philippines and Hong Kong, labor-market releases in South Korea and Malaysia, and Taiwan’s trade figures will provide a broader view of regional activity and export demand.
Corporate results from SoftBank, Honda and other Asian companies will offer further evidence on technology investment, consumer spending and industrial profitability.
What Investors Should Watch
1. Will US Inflation Reinforce Expectations of Another Fed Hike?
October CPI and PPI, together with remarks from Fed officials, will shape expectations for December monetary policy following the stronger October employment report.
2. Can AI-Related Stocks Stabilize After the Selloff?
Investors will watch whether technology shares recover and whether corporate results justify high infrastructure spending and valuation assumptions.
3. Is China’s Recovery Becoming More Balanced?
October inflation, trade and credit data will show whether external demand remains resilient while domestic consumption and private-sector activity improve.
4. Will European Growth Hold Up Against Price Pressures?
UK GDP, euro-area growth and employment data, and regional inflation readings will test the resilience of activity amid elevated energy and financing costs.
Global Equities: Technology Selloff Deepens Despite Friday Rebound
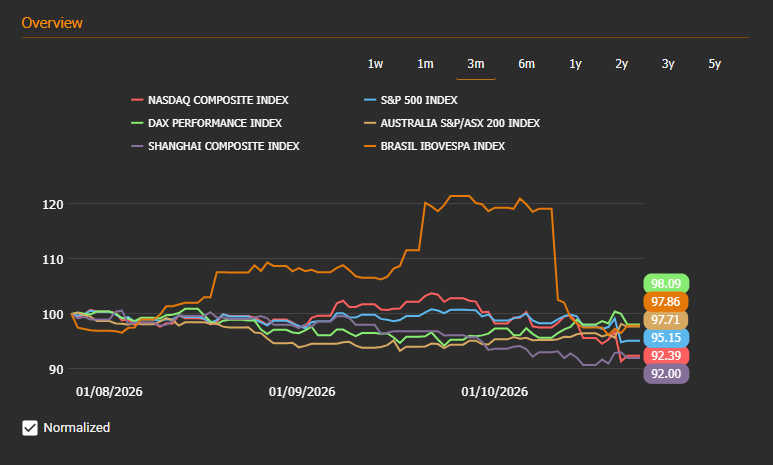
Global equities experienced another volatile week ending November 6, as concerns about AI valuations, capital spending and financing costs triggered a broad reassessment of technology shares. The US midterm election outcome and changing expectations for Federal Reserve policy added to market swings.
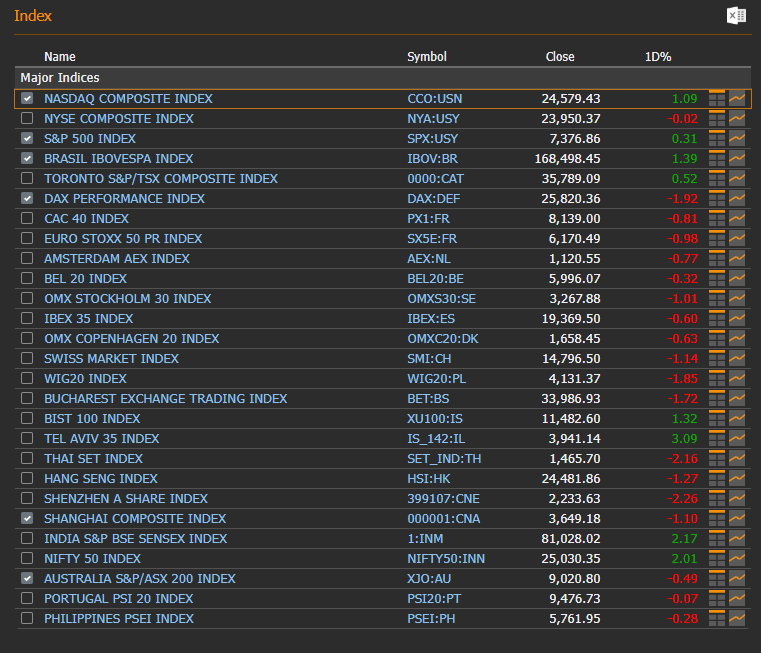
US stocks finished Friday mixed after stronger-than-expected October payrolls lifted Treasury yields and the dollar. The S&P 500 gained 0.31% to 7,376.86 and the Nasdaq rose 1.09% to 24,579.42, while the Dow fell 0.46% to 51,285.73. The Friday rebound did not erase the wider weekly weakness.
Technology stocks remained the central source of volatility, with semiconductor shares recovering on Friday after heavy earlier selling. Investors continued to question whether AI-related revenue growth can justify rising infrastructure investment and elevated valuations.
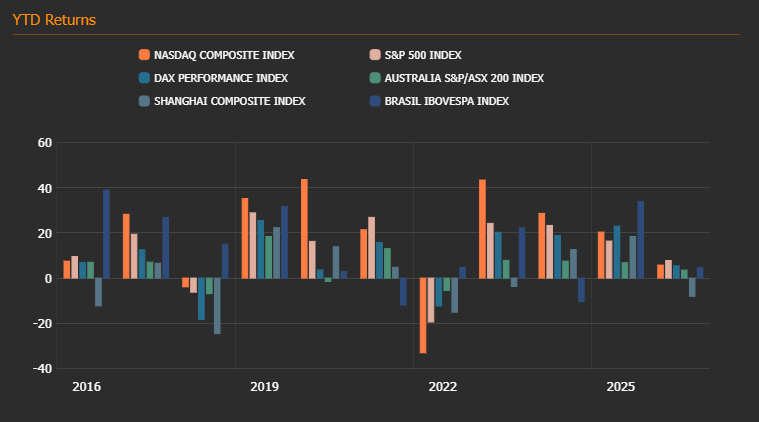
Regional performance was uneven as European and Asian equities responded to shifting US policy expectations, currency movements and concerns about technology demand. The coming week’s inflation data and corporate earnings will test whether risk appetite can stabilize.
*The Dow quoted is the standard price-weighted index; it should not be confused with any equal-weighted Dow series.
Source: EquityRT Markets Overview. Data as of 06/11/2026
Commodity Markets: Oil Retreats on Diplomacy Hopes as Gold Rebounds
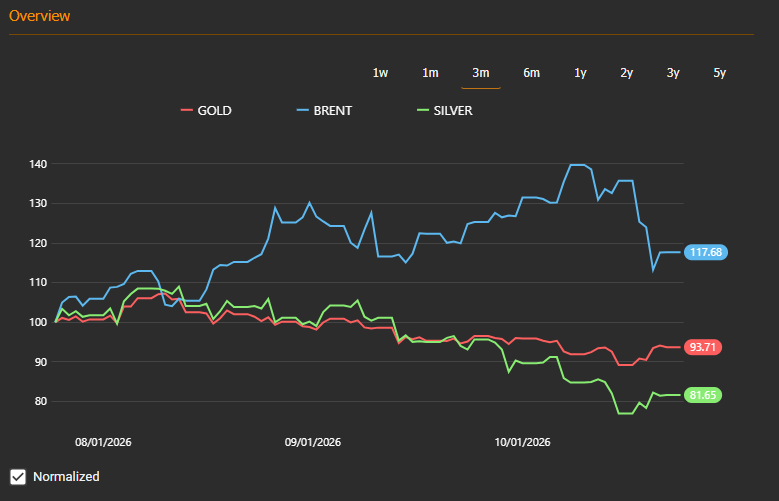
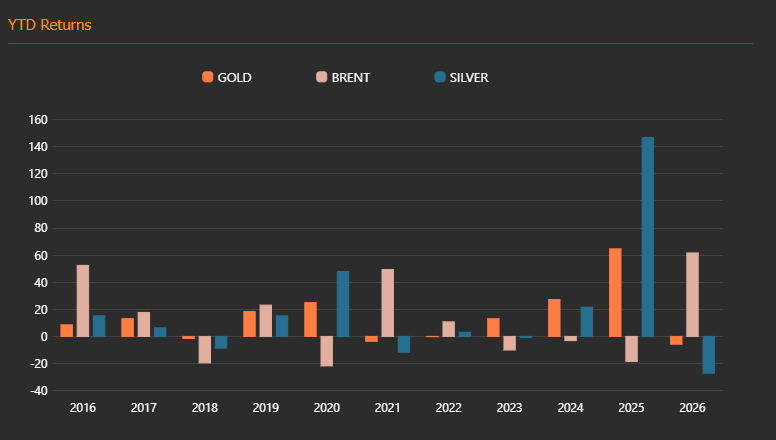
Commodity markets diverged during the week ending November 6. Oil prices retreated as hopes of reduced US-Iran tensions eased immediate supply concerns, although renewed Middle East disruptions remained a significant upside risk. Brent traded around the $100-per-barrel area late in the week, underscoring continued sensitivity to geopolitical developments.
Gold recovered strongly over the week after three consecutive weekly declines, supported by defensive demand and shifts in bond yields. The metal nevertheless fell on Friday as the stronger US employment report lifted the dollar and Treasury yields. Silver also registered a weekly advance, while industrial metals reflected concerns over global growth and AI-related capital spending.
The divergence highlights competing macroeconomic forces: reduced supply fears can ease energy-driven inflation expectations, while stronger employment and persistent price pressures may keep monetary policy restrictive. Precious metals remain sensitive to both real yields and shifts in demand for defensive assets.
Source: EquityRT Commodity Overview. Data as of 06/11/2026
U.S. Yield Curve: Payrolls Lift Yields After a Safe-Haven Rally
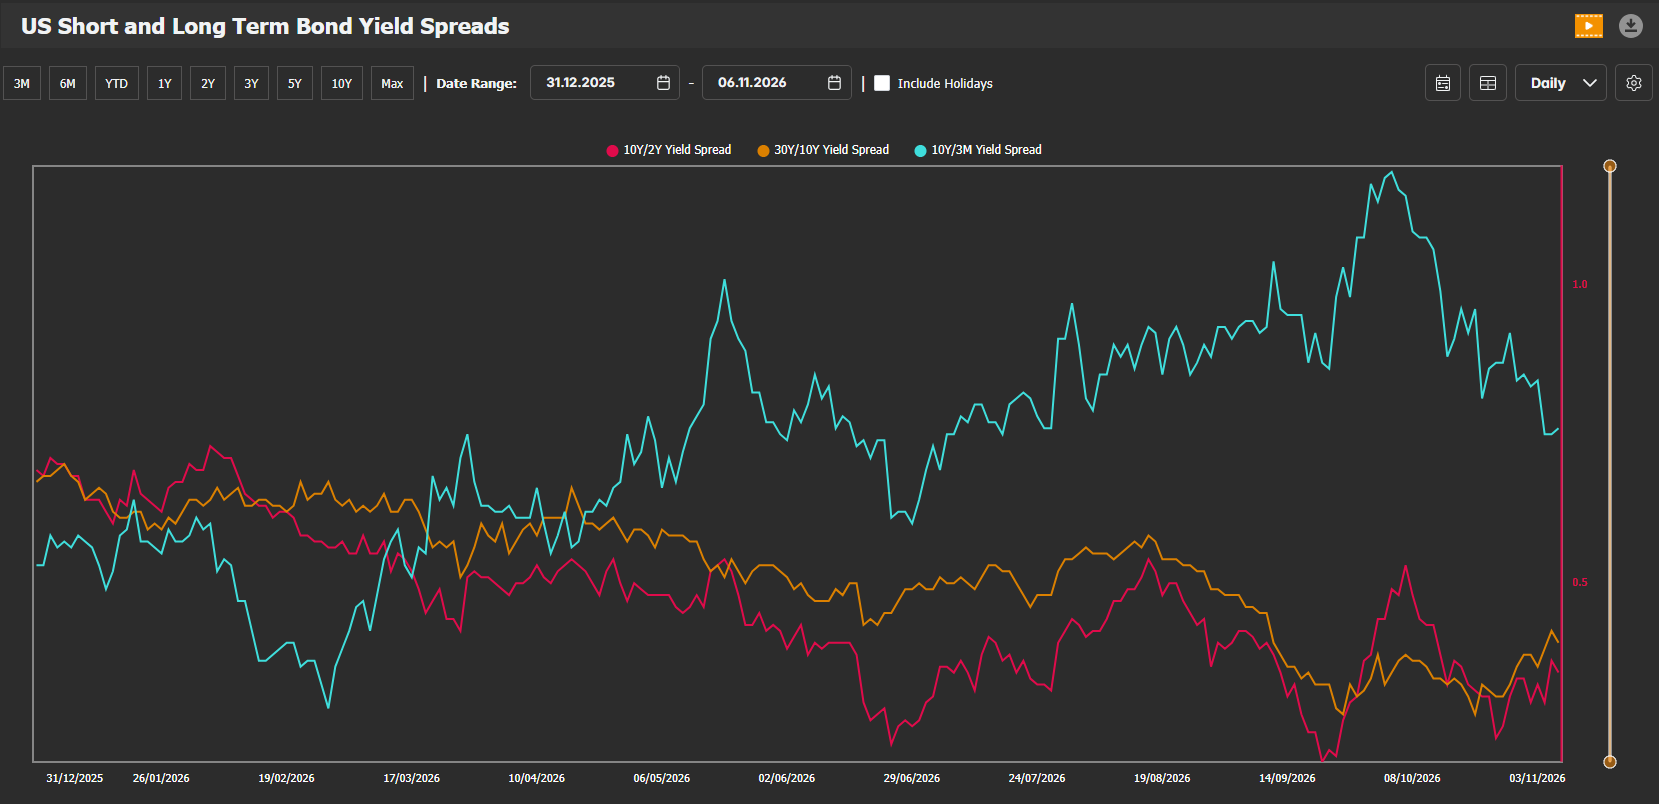
US Treasury yields fell earlier in the week as equity-market weakness supported demand for government bonds and investors considered the possibility of slower AI-related borrowing. The benchmark 10-year yield approached 4.83% on Thursday, its lowest level since early September, before rebounding after Friday’s stronger-than-expected employment report.
The October payrolls report prompted markets to reassess the likelihood of another Federal Reserve rate increase in December, putting renewed upward pressure on yields. The curve remains sensitive to both expectations for short-term policy rates and longer-term inflation and fiscal risks; a change in its slope should not be attributed to a single factor.
October CPI and PPI will be the next major tests. Softer inflation could revive demand for Treasurys, while upside surprises could push yields higher and maintain pressure on housing, corporate financing and equity valuations.
Source: EquityRT ChartPro, Data as of 06/11/2026
Gold vs. DXY: Weekly Gold Recovery Meets Friday Dollar Strength
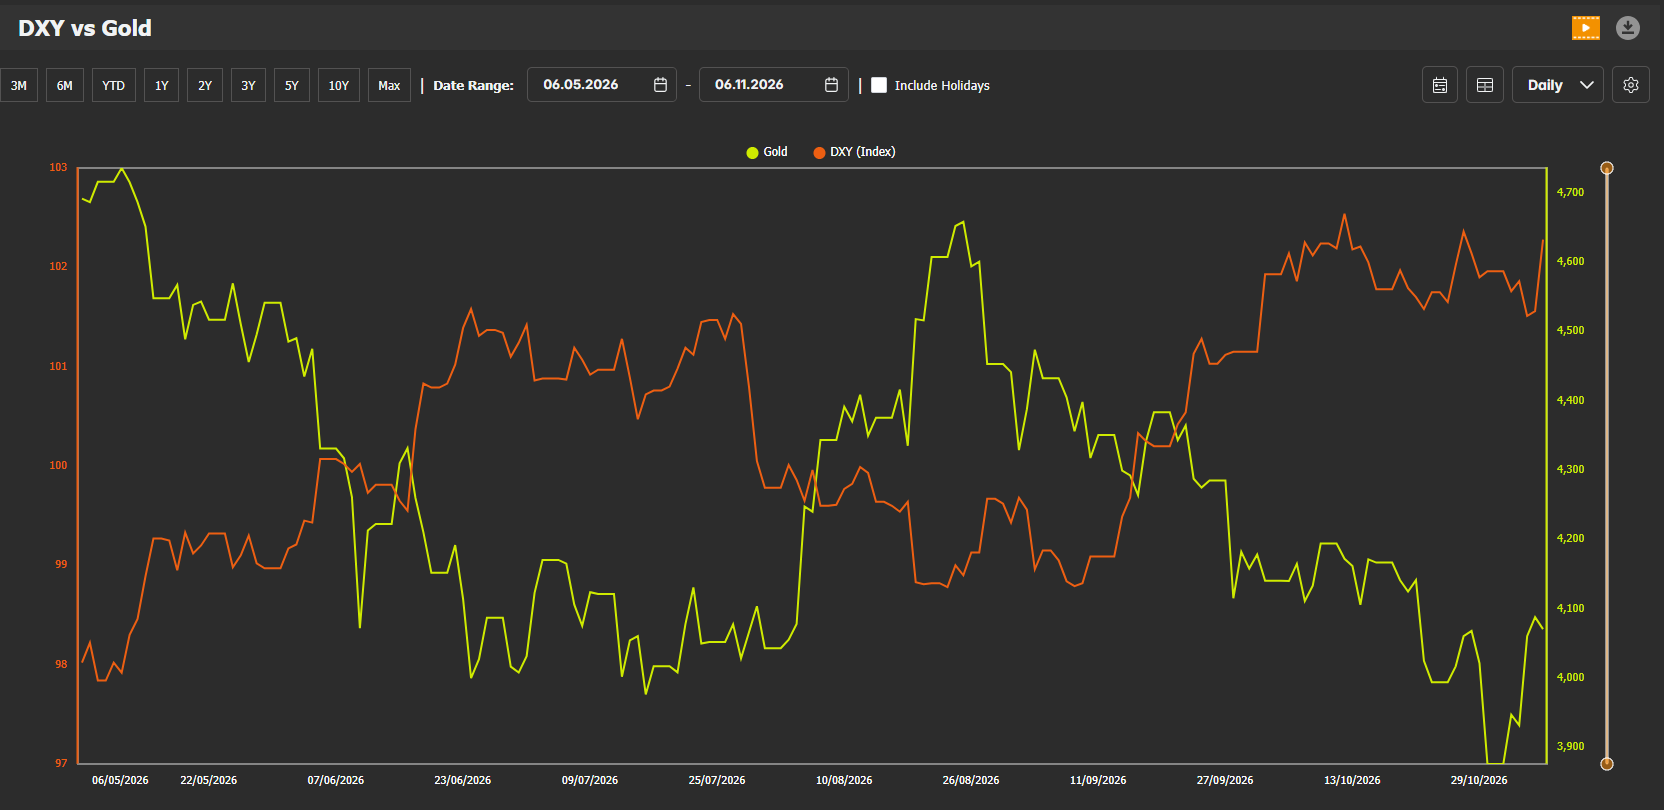
Gold posted a strong weekly recovery through November 6 despite weakening on Friday. Stronger-than-expected US payroll growth supported the dollar and Treasury yields, increasing the opportunity cost of holding non-yielding bullion and briefly pushing gold toward $4,033 an ounce intraday.
Spot gold recovered to around $4,074 an ounce late Friday and remained up approximately 5% over the week. The contrast between its weekly advance and Friday’s retreat illustrates how defensive demand and shifting policy expectations can pull gold and the dollar in different directions over short periods.
Source: EquityRT ChartPro, Data as of 06/11/2026
📈 Chart of the Week: Treasury Yields Retreat Ahead of Key US Inflation Data
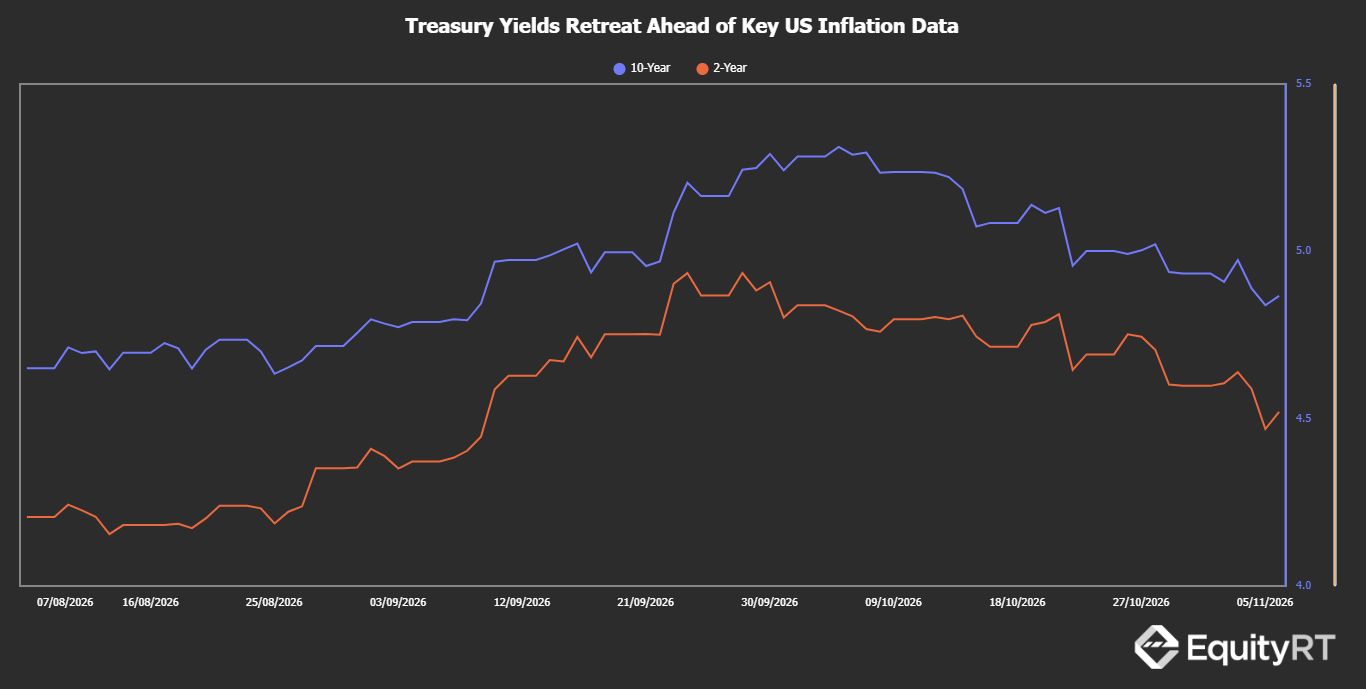
US Treasury yields have eased from their early October highs, reflecting shifting expectations for Federal Reserve policy amid uncertainty over the economic outlook. Both 2-year and 10-year yields declined through late October and early November, although a modest rebound toward the end of the week highlighted continued sensitivity to economic data.
With October's Consumer Price Index (CPI) release approaching, investors are closely watching whether inflation pressures will reinforce expectations of restrictive monetary policy or allow room for a less hawkish Fed stance. A stronger-than-expected reading could push yields higher, while softer inflation may support a further decline, particularly in shorter-term maturities.
Source: EquityRT | Data as of 06/11/2026