Weak energy demand in the early months of 2020 due to the Covid-19 crisis drove the commodity prices to their lowest levels. Oil prices were also depressed and even turned negative when the pandemic locked down the economies in 2020.
A stronger-than-anticipated economic recovery in 2021 with a help of abundant liquidity and expansionary fiscal policy has favored rising almost all commodity prices.
All the information you need in one place. Add EquityRT to your toolkit for quality investment research.
Gas prices in October 2021 are almost 400% more expensive than 7 months ago.
The record-high levels of natural gas prices encouraged utilities to switch to the use of carbon-heavy coal to generate electricity in the United States, Europe, and Asia. As a result, global coal prices increased more than five times higher than a year ago as the world’s largest coal-consuming economies, China and India, have low stock levels.
Rising costs due to tight supply and high demand are threatening to raise inflation and weighing heavily on factory production.
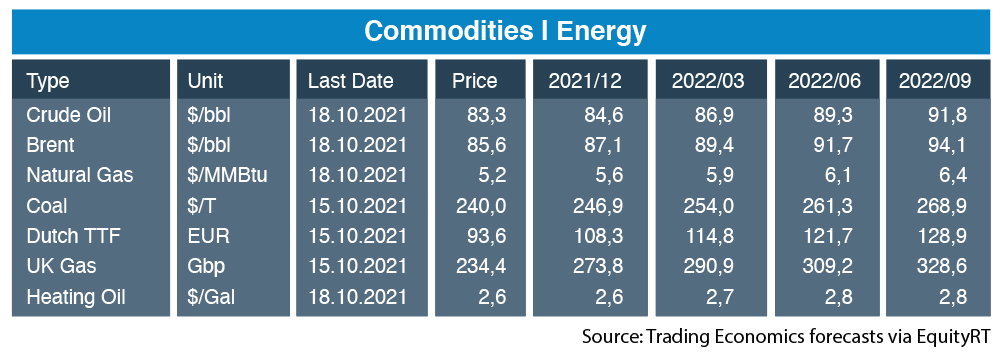
The table below shows the price estimates on selected energy commodities for the upcoming four quarters.
Current market dynamics suggest that the natural gas (TTF) and coal in Europe will remain high through 2021-2022 depending on the severity of the supply shortages, the strength of economic growth, and winter conditions.
Higher gas prices in Europe and Asia are expected to support demand as producers make the switch from gas to oil. The price for crude and brent oil is estimated to continue rising through the end of 2021 and into 2022.

Why to Follow Commodity Prices and Energy Indices
Commodities are the main input costs for many firms that trade on stock markets. When commodity prices rise, the production costs of firms also rise and this can weigh on the firm’s stock price.
Analysts follow the broad energy markets by monitoring the performance of some of the main indices that track the industry. Energy indices can be intended to use as a barometer for the health of the industry because they measure the performance of the shares companies are engaged in the production and sales of energy.
EquityRT’s Commodity Market Coverage
The “Commodity” section of the EquityRT offers daily prices, yields, and quarterly estimates on the most important hard commodity futures and indices. Historical data provides up to 10 years of daily prices for each commodity.
The coverage on energy contains Ethanol, Natural Gas, Crude Oil, Brent, Naptha, Uranium, Gasoline, Propane, Methanol, UK Gas and Dutch TTF Gas and the indices include, Wind Energy Index, Solar Energy Index, Nuclear Energy Index, and the EU Carbon Permits.
Please contact us to get more info on the content we provide on daily commodity prices and quarterly estimates.
Report by Özge Gürses | Macro Research at EquityRT
