Global Stock Market Highlights
Last Friday, U.S. stocks ended mixed on Friday in a quiet session after the Juneteenth holiday. Oil prices, and the stock market, have been swinging due to concerns that the conflict could disrupt global oil supplies. Iran, a key producer, controls the Strait of Hormuz, a crucial oil transit route.
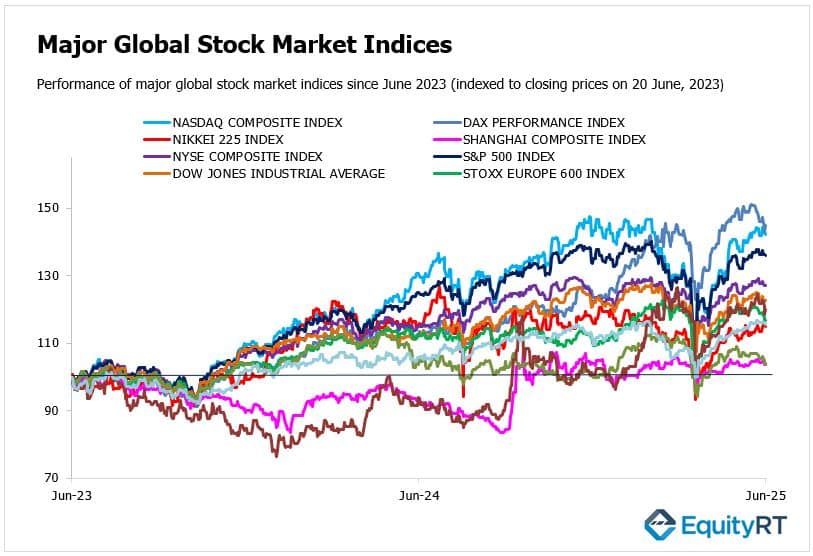
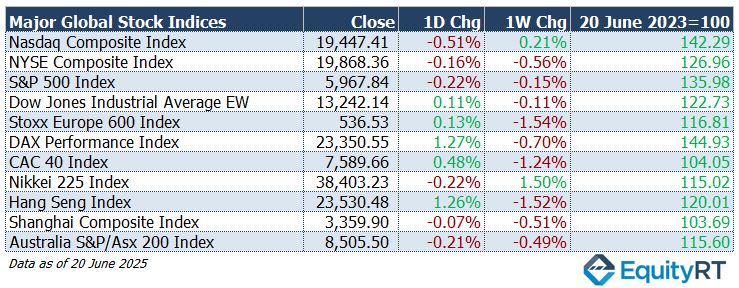
- Nasdaq Composite Index closed at 19,447.41, down 0.51% on the day and up 0.21% for the week.
- NYSE Composite Index closed at 19,868.36, down 0.16% on the day and down 0.56% for the week.
- S&P 500 Index closed at 5,967.84, down 0.22% on the day and down 0.15% for the week.
- Dow Jones Industrial Average EW closed at 13,242.14, up 0.11% on the day and down 0.11% for the week.
Investor sentiment improved following news that U.S. involvement in the Middle East might be delayed, creating space for diplomacy. Banks and travel & leisure stocks led gains, energy lagged slightly.
- Stoxx Europe 600 Index closed at 536.53, up 0.13% on the day and down 1.54% for the week.
- DAX Performance Index closed at 23,350.55, up 1.27% on the day and down 0.70% for the week.
- CAC 40 Index closed at 7,589.66, up 0.48% on the day and down 1.24% for the week.
Most Asian markets gained ground on Friday, supported by a cooling in geopolitical risk and a more optimistic global outlook. Japan and Australia bucked the trend slightly due to local headwinds.
- Nikkei 225 Index closed at 38,403.23, down 0.22% on the day and up 1.50% for the week.
- Hang Seng Index closed at 23,530.48, up 1.26% on the day and down 1.52% for the week.
- Shanghai Composite Index closed at 3,359.90, down 0.07% on the day and down 0.51% for the week.
- Australia S&P/ASX 200 Index closed at 8,505.50, down 0.21% on the day and down 0.49% for the week.
- The Dollar Index (DXY), a closely watched gauge of the U.S. dollar’s performance against other major currencies, closed at 98.71, down 0.10% on the day, up 0.54% for the week, and down 8.98% year-to-date.
- The Brent crude oil, the global oil price benchmark, closed at 77.27, up 0.74% on the day, up 4.10% for the week, and up 3.52% year-to-date.
- The Gold closed at 3,367.91, down 0.05% on the day, down 1.89% for the week, and up 28.33% year-to-date.
- The 2-year U.S. Treasury yield particularly responsive to Federal Reserve policy rates, ended at 3.92 bps, down 1.50 bps on the day, down 4.20 bps for the week, and down 33.60 bps year-to-date.
- The 10-year U.S. Treasury yield, an indicator of long-term borrowing costs, ended at 4.38 bps, down 0.30 bps on the day, down 2.30 bps for the week, and down 19.30 bps year-to-date.

Take the Guesswork out of Investing: Backtest Your Strategies with Ease!
Upcoming U.S. Economic Indicators to Watch This Week
In the U.S., all eyes will be on Federal Reserve Chair Jerome Powell as he delivers testimony before Congress this week. Investors will be listening closely for any signals regarding the Fed’s future rate path and overall economic outlook. Several other Fed officials are also scheduled to speak, potentially reinforcing or refining the messaging.
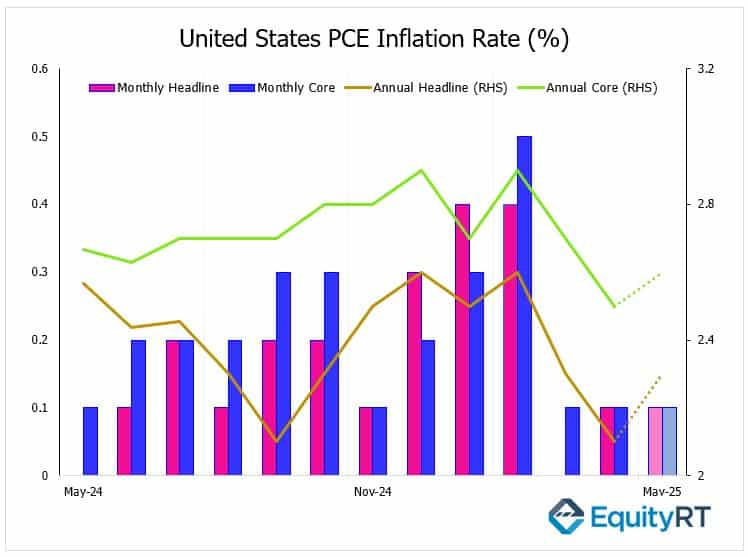
The May PCE inflation report, scheduled for release this Friday, is expected to play a crucial role in shaping the Federal Reserve’s policy outlook.
Headline PCE inflation is forecast to rise to 2.3% year-on-year, up from 2.1% in April, while the core PCE index, which excludes food and energy, is anticipated to increase to 2.6% from the previous 2.5%. On a monthly basis, economists estimate core PCE rose by about 0.1% to 0.12% in May, marking the third consecutive month of modest gains.
Given that PCE is the Fed’s preferred inflation gauge, even a slight increase in the figures may prompt policymakers to delay expected interest rate cuts. Analysts also highlight that recent tariff-related price pressures are beginning to filter through to the data, making this release particularly relevant for the inflation outlook in the coming months.
Alongside inflation, May’s report is expected to show that personal spending increased by 0.3%, slightly above April’s 0.2% gain. However, income growth likely slowed to 0.4%, down from a sharp 0.8% rise in the previous month.
Durable goods orders, which fell sharply in April, are expected to rebound strongly by 4.5%.
Flash S&P Global PMI data for June is likely to show a deceleration in growth across both manufacturing and services due to ongoing trade uncertainty.
Additional U.S. releases will cover existing, new, and pending home sales; the Case-Shiller home price index; consumer confidence from the Conference Board; the final Q1 GDP figures; advance estimates of goods trade and inventories; and the final University of Michigan consumer sentiment reading.
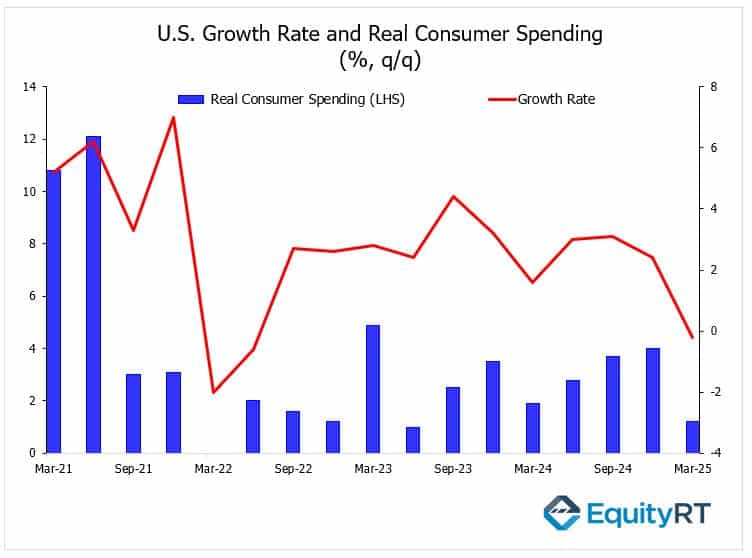
The final estimate of U.S. GDP growth for Q1 2025 and real consumer spending figures will be released this Thursday. Although Thursday’s final GDP release is not expected to show major revisions, investors will be paying close attention to the breakdown of consumer spending, especially ahead of the May PCE inflation report and the Federal Reserve’s next policy decisions.
The U.S. economy grew by 1.6%, 3%, 3.1%, and 2.4% in the four quarters of last year, respectively. However, in the first quarter of 2025, it recorded its first contraction since early 2022, with the decline slightly revised from -0.3% to -0.2%. This revision was mainly driven by a rise in fixed investments, which partly offset the weakness in consumer spending and net exports.
The sharp increase in imports, following tariff announcements under the Trump administration, had a negative impact on net exports.
Consumer spending, which accounts for a major part of the economy, was revised down from 1.8% to 1.2%, marking its weakest pace since Q2 2023.
Elsewhere in the Americas, Canada will publish May inflation and GDP figures. Mexico will release trade and unemployment data, while Brazil is due to report labor market conditions. Additionally, the Bank of Mexico will meet to determine its latest policy stance.
Unleash Your Investment Potential. EquityRT might be the missing puzzle piece to reach your ultimate investment strategy.
European Economic Trends: This Week’s Macro Insights
In Europe, investors closely watched the flash PMI readings from the region’s largest economies. The HCOB Eurozone Composite PMI held steady at 50.2 in June 2025, unchanged from May and slightly below the forecast of 50.5. While this marked the sixth straight month above the 50.0 expansion threshold, it continued to signal only modest economic growth across the region.
German sentiment indicators are anticipated to rise, with the GfK Consumer Climate Index set for a fourth consecutive monthly gain and the Ifo Business Climate expected to reach its highest level in a year.
Inflation data from Spain and France will be closely followed; Spain’s annual CPI is forecast to remain at 2%, in line with the European Central Bank’s target, while French prices are expected to rise 0.2% from the previous month.
In the UK, focus turns to the final estimate of Q1 GDP, along with surveys from the Confederation of British Industry on industrial trends and distributive trades.
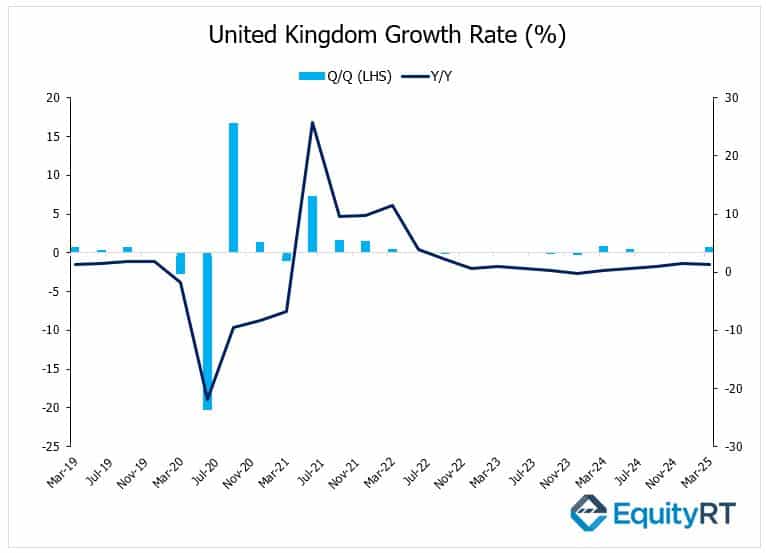
This week, the UK will also release current account data. In June 2025, the S&P Global UK Manufacturing PMI rose to 47.7 from 46.4 in May, beating expectations and marking the slowest contraction in five months. Meanwhile, the Services PMI increased to 51.3 from 50.9, aligning with forecasts and signalling continued modest growth in the sector.
Additional European data releases will include Eurozone car registrations, business sentiment, and various consumer and business indicators from Turkey, France, Italy, and Spain, along with unemployment figures for France.
Take the Guesswork out of Investing: Backtest Your Strategies with Ease!
Asian Economic Data: This Week’s Outlook
In China, attention will turn to the Standing Committee of the National People’s Congress, which will convene from June 24 to 27. The meeting is expected to address anti-monopoly regulations and possible responses to new U.S. tariffs, amid heightened geopolitical tensions.
Investors will also follow data on Chinese industrial profits. Profits at China’s industrial firms grew by 1.4% year-on-year in the first four months of 2025, reaching CNY 2,117.02 billion (approx. 292 billion USD). This marks an improvement from the 0.8% increase seen in the January–March period, highlighting the impact of Beijing’s ongoing measures to support the weak economy and tackle rising trade challenges.
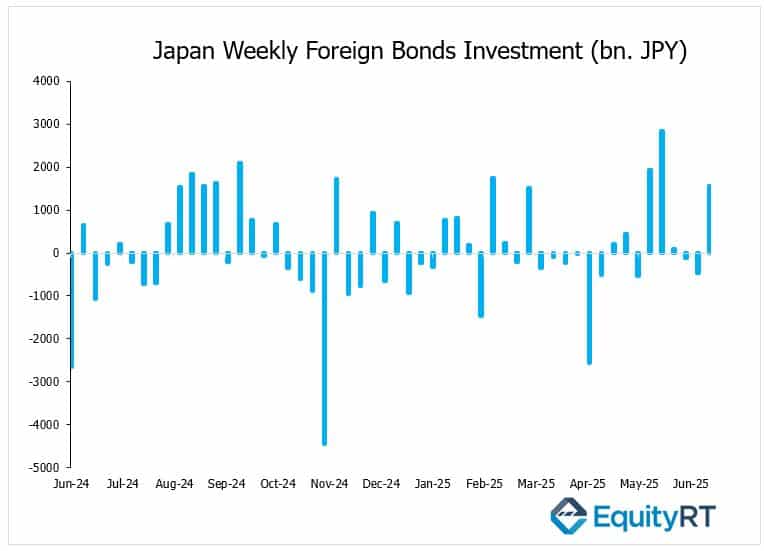
In Japan, the week is rich with data, including flash PMIs, retail sales, the unemployment rate, and inflation figures for Tokyo. Additionally, the Bank of Japan’s Summary of Opinions will be released, potentially offering deeper insights into the central bank’s thinking on policy normalization. Foreign bond investment data in the week ending June 21 of 2025 will also be released.
In Australia, the focus will be on the monthly CPI Indicator, an important signal of inflation trends.
Across the broader Asia-Pacific region, markets will watch for India’s inflation data from Singapore and Malaysia, and the interest rate decision from the Bank of Thailand.
