Global Stock Market Highlights
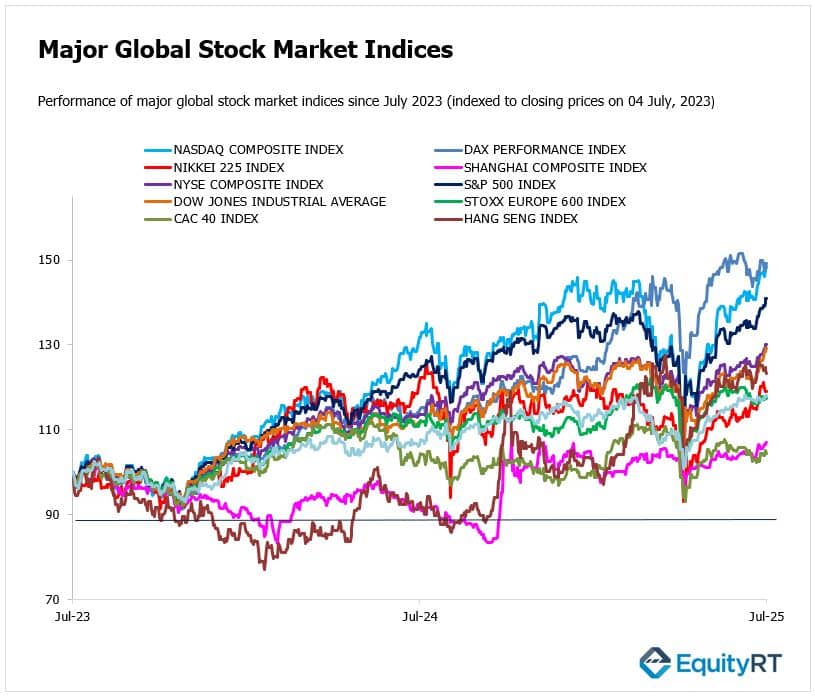
On Friday, July 4, 2025, U.S. financial markets were closed in observance of Independence Day. On July 3, 2025, U.S. stock markets closed higher, buoyed by a stronger-than-expected June jobs report. The S&P 500 and Nasdaq Composite both reached new record highs, while the Dow Jones Industrial Average also posted gains. The shortened trading session, ahead of the Independence Day holiday, saw increased investor optimism:
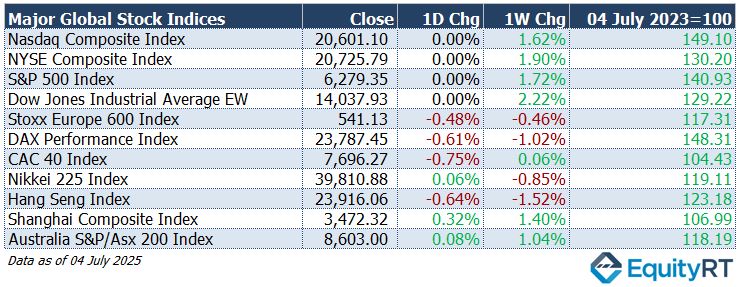
- Nasdaq Composite Index closed at 20,601.10, unchanged on the day and up 1.62% for the week.
- NYSE Composite Index closed at 20,725.79, unchanged on the day and up 1.90% for the week.
- S&P 500 Index closed at 6,279.35, unchanged on the day and up 1.72% for the week.
- Dow Jones Industrial Average EW closed at 14,037.93, unchanged on the day and up 2.22% for the week.
European markets faced downward pressure amid escalating trade tensions following U.S. President Donald Trump’s announcement of new tariffs. The U.S. plans to issue letters detailing tariffs ranging from 10% to 70%, with the first batch expected on July 4.
- Stoxx Europe 600 Index closed at 541.13, down 0.48% on the day and down 0.46% for the week.
- DAX Performance Index closed at 23,787.45, down 0.61% on the day and down 1.02% for the week.
- CAC 40 Index closed at 7,696.27, down 0.75% on the day but up 0.06% for the week.
Asian markets exhibited mixed performance, influenced by the looming U.S. tariff deadline:
- Nikkei 225 Index closed at 39,810.88, up 0.06% on the day but down 0.85% for the week.
- Hang Seng Index closed at 23,916.06, down 0.64% on the day and down 1.52% for the week.
- Shanghai Composite Index closed at 3,472.32, up 0.32% on the day and up 1.40% for the week.
- Australia S&P/ASX 200 Index closed at 8,603.00, up 0.08% on the day and up 1.04% for the week.
- The Dollar Index (DXY), a closely watched gauge of the U.S. dollar’s performance against other major currencies, closed at 96.99, down 0.14% on the day, down 0.29% for the week, and down 10.57% year-to-date.
- The Brent crude oil, the global oil price benchmark, settled at $68.28 per barrel, declining 0.52% on the day but gaining 2.22% over the week, though still down 8.52% year-to-date.
- The Gold rose to $3,335.24 per ounce, up 0.27% on the day, up 2.05% for the week, and showing a strong year-to-date increase of 27.09%.
- The 2-year U.S. Treasury yield particularly responsive to Federal Reserve policy rates, held steady at 3.89 basis points, unchanged on the day but up 14.40 basis points for the week, and down 36.00 basis points year-to-date.
- The 10-year U.S. Treasury yield, an indicator of long-term borrowing costs, remained flat at 4.35 basis points, with no daily change, a 6.60 basis point increase over the week, and a year-to-date decline of 22.50 basis points.

Take the Guesswork out of Investing: Backtest Your Strategies with Ease!
Upcoming U.S. Economic Indicators to Watch This Week
Investors will closely watch trade developments in the U.S. as the July 9 deadline approaches, marking the end of the tariff pause announced in April. The Trump administration has started sending formal letters to trading partners detailing the tariff rates they will face. So far, only a few deals have been finalized, notably with the UK, Vietnam, and a framework agreement with China.
The second quarter earnings season begins in mid-July, with early reports from Delta Air Lines and Conagra Brands. Attention will also focus on the release of the FOMC minutes, as traders seek further insight into the Federal Reserve’s policy direction for the rest of the year. Fed Chair Powell continues to adopt a cautious, wait-and-see stance. Economically, the U.S. calendar remains relatively light, with key figures including weekly jobless claims, consumer credit, the NFIB Small Business Sentiment Index, and the federal government’s monthly budget statement.
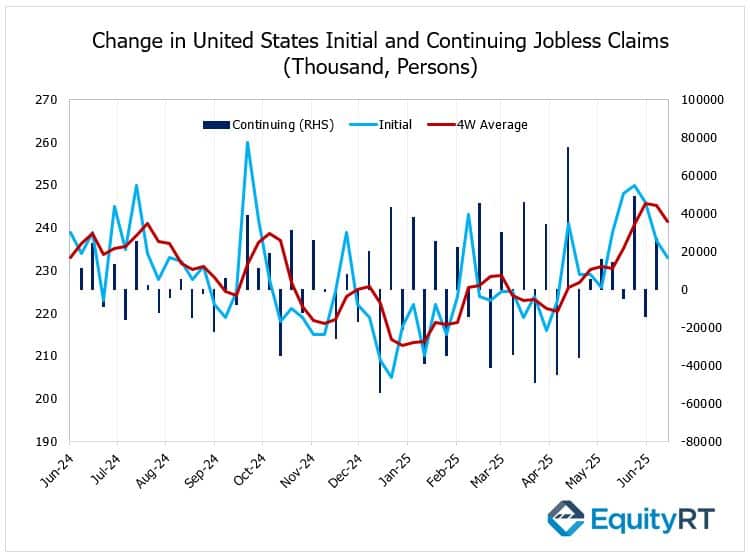
The next release, covering the week ending July 5 (to be published on Thursday, July 10), is forecast at around 240,000 new claims, according to consensus estimates. The previous week’s actual claims were 233,000, which was lower than the 240,000 forecast and down from 237,000 the prior week.
Analysts typically view a figure below expectations as encouraging for the U.S. labor market, indicating potential strength. Conversely, the number above forecast could raise concerns about softening employment and weigh on investor sentiment.
The Federal Reserve remains cautious, watching for any sign of labor market softening that could justify further rate cuts later this year. A sudden uptick in claims might strengthen the case for policy easing.
In Canada, June employment figures and the Ivey PMI will be published. Mexico’s inflation data and Brazil’s inflation, retail sales, and business confidence updates will also draw market attention.
Unleash Your Investment Potential. EquityRT might be the missing puzzle piece to reach your ultimate investment strategy.
European Economic Trends: This Week’s Macro Insights
Germany’s industrial production unexpectedly rose by 1.2% month-over-month in May 2025, beating market expectations of flat growth.
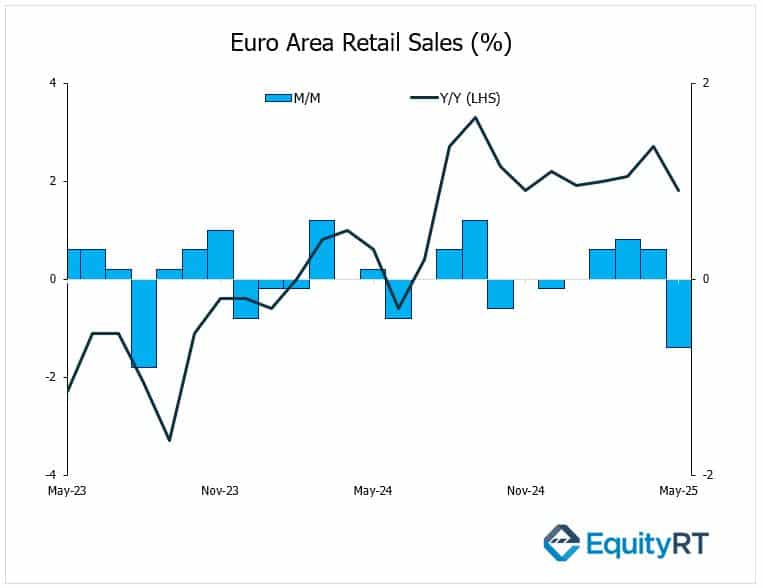
Euro Area retail sales fell by 0.7% month-over-month in May 2025, the steepest decline since August 2023, following an upwardly revised 0.3% gain in April and in line with market expectations. The drop was driven by weaker demand.
Key releases include trade balance data for Germany and France, Germany’s wholesale prices, and Turkey’s industrial production. Switzerland will publish consumer confidence figures, and Russia will report its inflation rate. Final June inflation data for Germany, Italy, and France will also be in focus.
In the UK, markets will look to monthly GDP, industrial production, trade balance, and Halifax’s house price index.
Take the Guesswork out of Investing: Backtest Your Strategies with Ease!
Asian Economic Data: This Week’s Outlook
In the Asia-Pacific region, markets will focus on China’s inflation and trade data. Consumer prices are expected to remain flat year-on-year, while producer price deflation is anticipated to ease but still show a 3.2% decline.
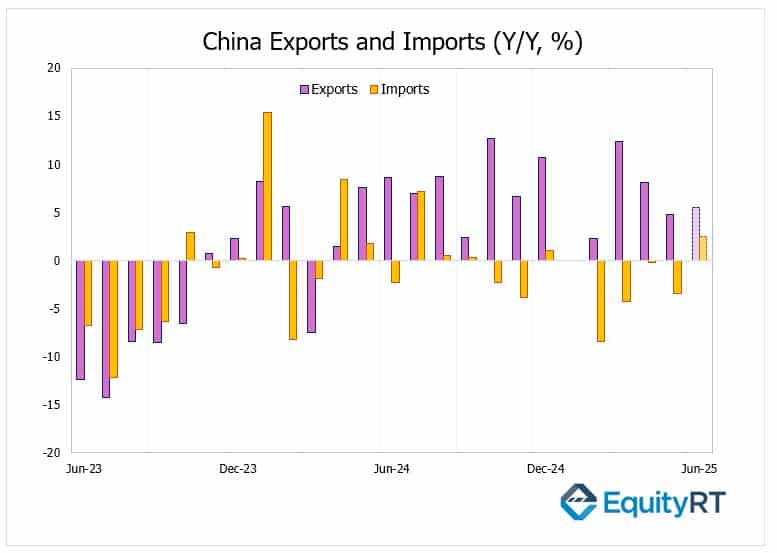
China’s trade dynamics continue to draw global attention amid ongoing tariff tensions and evolving economic conditions. China’s July 12 trade figures will offer fresh clues on whether the world’s biggest exporter is sustaining momentum amid tariff tensions and domestic headwinds and how global supply chains are adjusting.
In May 2025, China’s exports rose 4.8% year-on-year, slower than April’s 8.1% and slightly below forecasts. The biggest drag came from exports to the U.S., which plunged 34.5%, the steepest fall in over five years due to Trump-era tariffs and stalled trade talks. In contrast, shipments to the EU, ASEAN, Japan, Taiwan, and Australia all rose by double digits.
Imports dropped 3.4% year-on-year in May, a sharper fall than April’s tiny 0.2% decline and worse than market consensus. Domestic demand remains fragile, squeezed by weak consumer spending and policy uncertainty. Imports from the U.S. alone fell 18% despite a temporary tariff pause.
Japan will release major economic indicators, including wages, the current account, machine tool orders, and producer prices.
The Reserve Bank of Australia is widely expected to announce its third 25 basis point rate cut this year amid softening inflation and a weakening outlook. The Bank of Korea and Bank Negara Malaysia will also make policy decisions, while New Zealand’s central bank is expected to keep its official cash rate steady at 3.25%.
Investors will additionally monitor upcoming inflation reports from Vietnam, Thailand, and Taiwan, as well as GDP growth figures from Singapore.
