Global Markets Recap
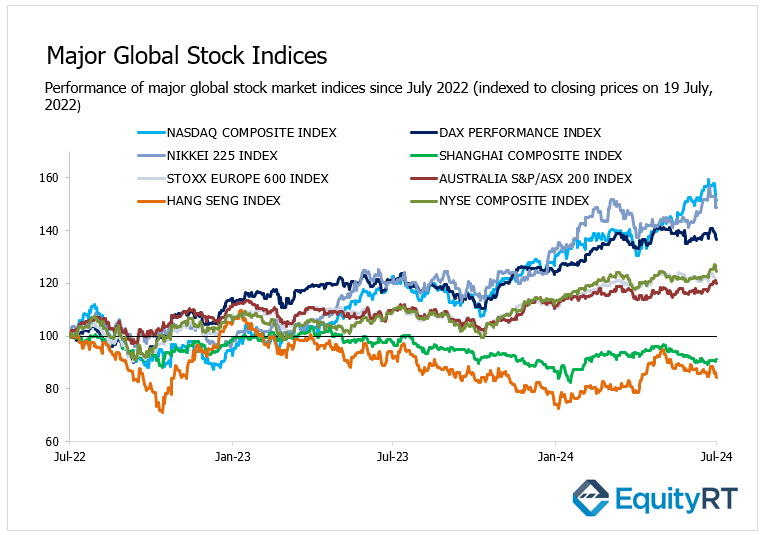
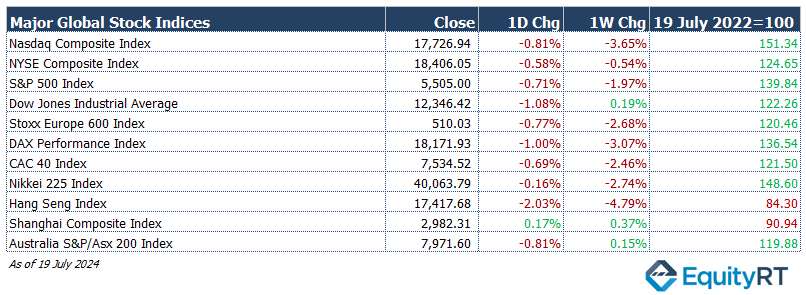
Following the crash of the Microsoft Windows operating system in several countries, Wall Street indices closed lower last Friday due to fears of decreased investor risk appetite.
All three major U.S. stock indexes finished in negative territory, with the Dow Jones Industrial Average experiencing the biggest decline.
The STOXX Europe 600, encompassing approximately 90% of the market capitalization of European markets across 17 countries, lost 14 points, or 2.68%, ending at 510.03.
Germany’s DAX decreased by 1%, to close at 18,172. France’s CAC-40 lost by 0.69% to finish at 7,534,52.
Japan’s Nikkei dropped by over 0.15% as Asia-Pacific markets experienced mixed trading. Meanwhile, Australia dropped by 0.81%.
The Dollar Index (#DXY), a closely watched gauge of the U.S. dollar’s performance against other major currencies, closed last week at 104.37 marking a 0.26% weekly gain.
The Brent crude oil (#LCO07) closed the previous week at USD 82.63 per barrel, reflecting a 2.82% weekly loss.
The price of gold (#XAU) closed last week with a 0.67% loss settling at USD 2,395 per ounce.
The 2-year U.S. Treasury yield (#USGG2YR), particularly responsive to Federal Reserve policy rates, closed at 4.52% with a 5.7 basis points weekly gain.
The 10-year U.S. Treasury yield (#USGG10YR) completed the week with a 5.5 basis points rise, settling at 4.24%.

Take the Guesswork out of Investing: Backtest Your Strategies with Ease!
Recent US Economic Indicators: Highlights from Last Week
Let’s take a look at the macroeconomic indicators and developments tracked in the US last week:
The Beige Book report for July, compiled from assessments by the Federal Reserve’s 12 district banks, was also released. The report noted moderate employment growth but highlighted that economic activity remained flat or declined in five districts.
In the US, industrial production in June increased by 0.6% monthly, slowing from 0.9% in May but still exceeding expectations of a 0.3% rise.
The capacity utilization rate rose from 78.3% in May to 78.8% in June.
New housing starts, a key indicator of the housing market, showed partial recovery with a 3% increase in June following a 4.6% rise in May.
Building permits, which indicate future housing demand, increased by 3.4% in June after a 2.8% decline in May, indicating a partial recovery after three months of decline.

Regarding the state of production, the New York Fed Empire State manufacturing index for July fell from -6 to -6.6, indicating a slight acceleration in the contraction of the manufacturing sector and marking the eighth consecutive month in negative territory.
Retail sales were flat in June (0%) after a 0.3% increase in May, with expectations for a 0.3% monthly decline.
Unleash Your Investment Potential. EquityRT might be the missing puzzle piece to reach your ultimate investment strategy.
Key U.S. Economic Indicators to Watch This Week
On Wednesday, the preliminary PMI data for the manufacturing and services sectors from S&P Global for July will be closely monitored, providing a signal on the latest state of economic activity.
On Thursday, the preliminary data for durable goods orders for June will be released. Durable goods orders are expected to increase from a 0.1% monthly rise to 0.5%.

Also on Thursday, the preliminary quarterly GDP growth data for the second quarter will be released. The annualized quarterly growth rate of the US economy was slightly revised upward from 1.3% to 1.4% in the first quarter, which was the lowest growth rate since the contraction in the second quarter of 2022. For the second quarter, the growth rate is expected to slightly increase from 1.4% to 1.9%.
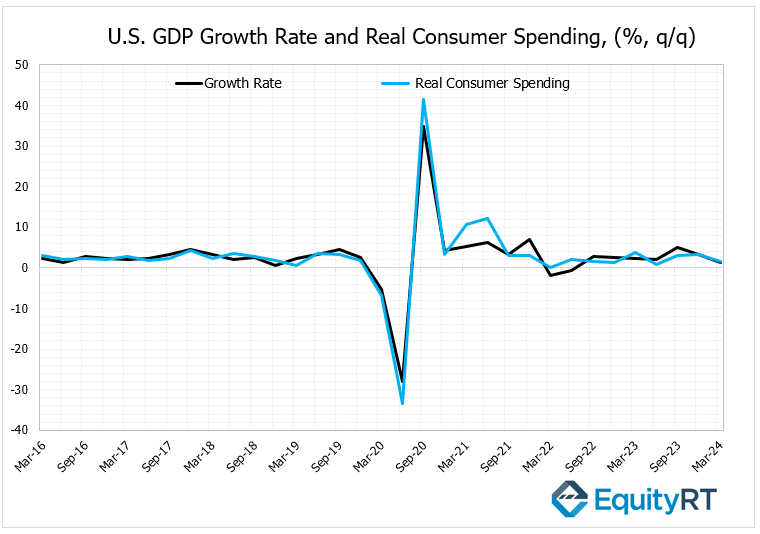
Consumer spending growth is expected to increase slightly from 1.5% to 1.8% in the second quarter.
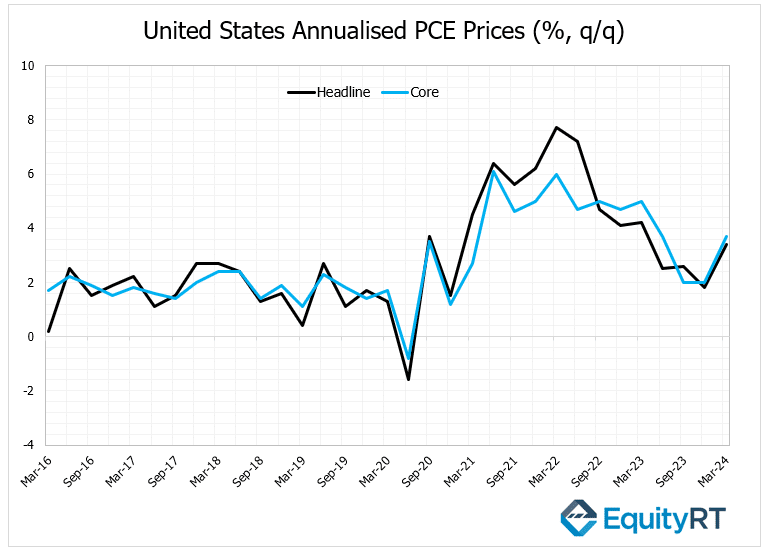
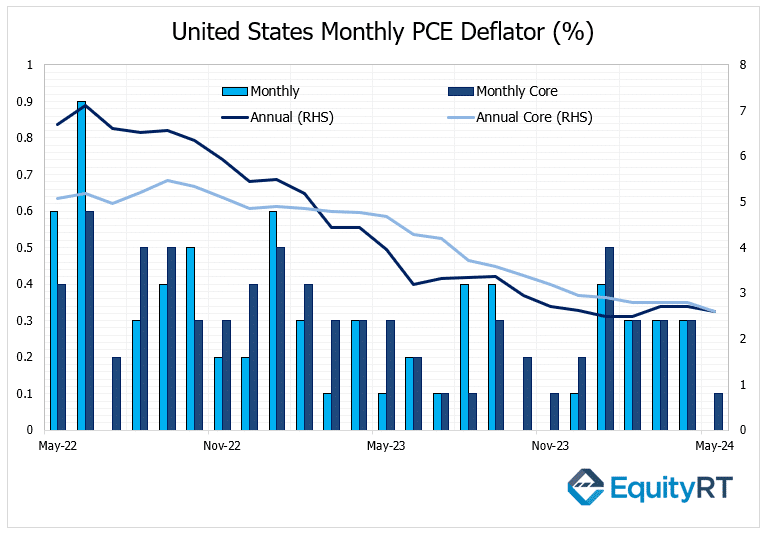
Additionally, on Thursday, the preliminary data for the Personal Consumption Expenditures (PCE) price index, which the Fed monitors as a key inflation indicator, will be released.
The annualised quarterly PCE price index was slightly revised upward from 3.3% to 3.4% in the first quarter. The core PCE price index was also slightly revised upward from 3.6% to 3.7%, indicating a slight acceleration in price pressures.
On Friday, the June data for the PCE deflator, personal income, and personal spending will be released.
The monthly PCE deflator is expected to remain flat at 0.1%, and to slightly decrease from 2.6% to 2.4% on an annual basis.
The core PCE deflator is expected to increase by 0.1% monthly, similar to the previous month, and to slightly decrease from 2.6% to 2.5% on an annual basis.
Personal income growth is expected to slow from 0.5% to 0.4% monthly in June, while personal spending growth is expected to increase from 0.2% to 0.3%.
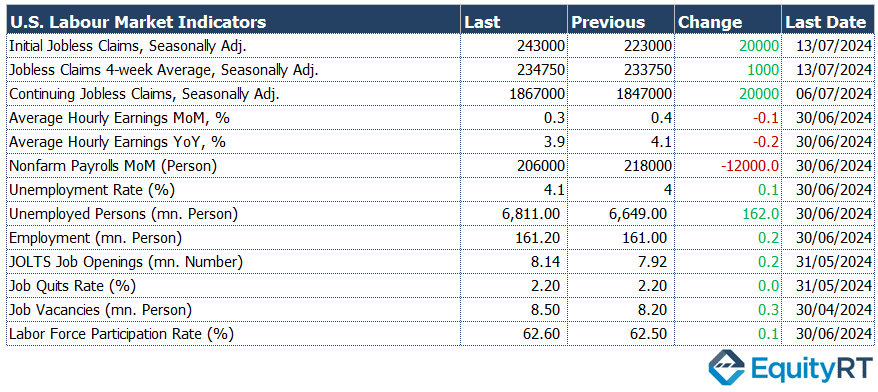
On Thursday, weekly jobless claims data will be watched. The most recent weekly jobless claims rose above expectations from 223,000 to 243,000, indicating a relatively tight labor market while remaining at low levels compared to historical averages.
On Friday, the final data for the University of Michigan Consumer Sentiment Index for July will be released.
Take the guesswork out of investing: Backtest your strategies with ease!
Key Economic Indicators From Europe Last Week
Following a 25 basis point cut in June, the ECB kept rates unchanged in last week’s meeting, aligning with expectations.
In the Eurozone, the headline CPI‘s monthly growth rate matched preliminary data, rising by 0.2% in June, the lowest in five months. On an annual basis, it slightly decreased from 2.6% to 2.5%, indicating gradual progress towards the ECB’s 2% target.
The core CPI remained steady at 2.9% annually in June, consistent with preliminary data.
In the Eurozone, the trade surplus decreased from €15 billion to €13.9 billion in May. Both exports and imports fell by 2.1% monthly.

Unleash Your Investment Potential. EquityRT might be the missing puzzle piece to reach your ultimate investment strategy.
European Economic Trends: This Week’s Market Insights
Tomorrow, the preliminary consumer confidence data for July will be released in the Eurozone.
On Wednesday, the preliminary PMI data for the manufacturing and services sectors from HCOB for July, which provides insights into the latest economic outlook across Europe, will be monitored.
On Wednesday, the GfK consumer confidence data for August, reflecting assessments for the coming month, will be released in Germany.
On Thursday, the IFO business climate index for July, which reflects evaluations of current and future economic conditions over the next six months by firms in manufacturing, construction, wholesale, and retail trade sectors, will be released in Germany.
Take the guesswork out of investing: Backtest your strategies with ease!
Asian Economic Indicators
In the second quarter of this year, China’s GDP growth rate slowed to 0.7% quarterly, down from 1.5%, marking the lowest level since the second quarter of 2023 and falling short of expectations (1.1%). On an annual basis, the growth rate also slowed from 5.3% to 4.7%, below the expected 5.1%.
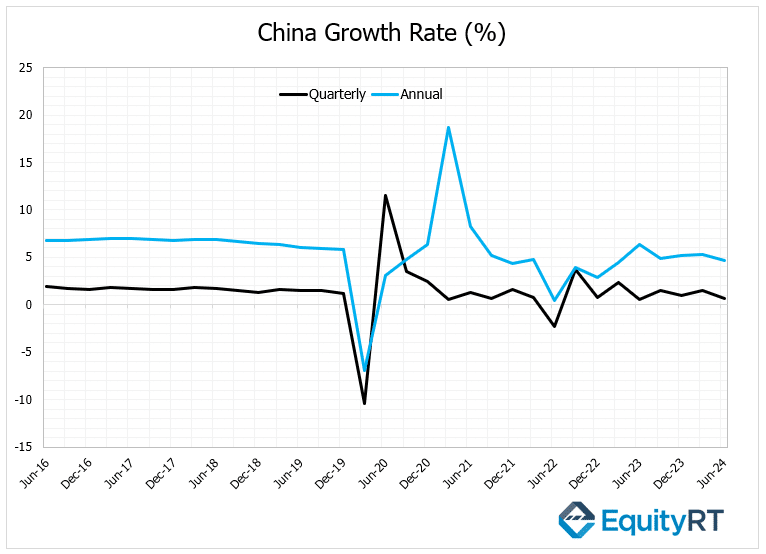
In June, the annual growth rate of industrial production in China slowed from 5.6% to 5.3%, though it exceeded expectations (5%).
Retail sales growth slowed significantly from 3.7% to 2%, the lowest since December 2022, and below the expected 3.3%.
Unleash Your Investment Potential. EquityRT might be the missing puzzle piece to reach your ultimate investment strategy.
Upcoming Asian Data
On Monday, the People’s Bank of China (PBoC) unexpectedly cut the benchmark 1-year loan prime rate (LPR) by 10 basis points from 3.45% to 3.35% to support economic activity.
The 5-year LPR, a reference for long-term loans such as mortgages, was also cut by 10 basis points from 3.95% to 3.85%.
Additionally, the PBoC lowered the 7-day reverse repo rate from 1.8% to 1.7%.
On Friday, the Russian Central Bank’s meeting will be monitored. The bank is expected to raise the policy rate by 200 basis points to 18%.
