Global Markets Recap
Last Friday, Wall Street indices closed Friday with gains exceeding 1% after stronger-than-expected U.S. employment data for September. Despite diminishing expectations for a 50 basis point interest rate cut from the Fed in the November meeting, investors focused on the healthy growth of the U.S. economy, which eased recession fears.
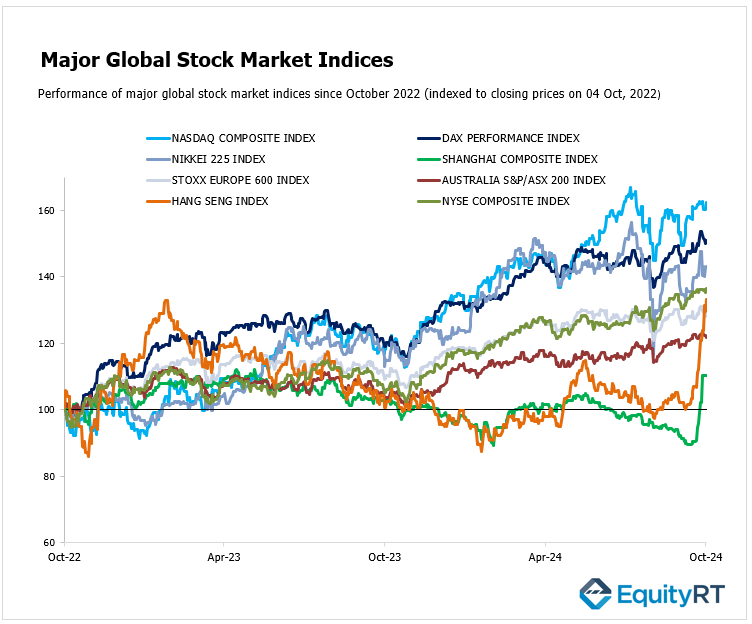
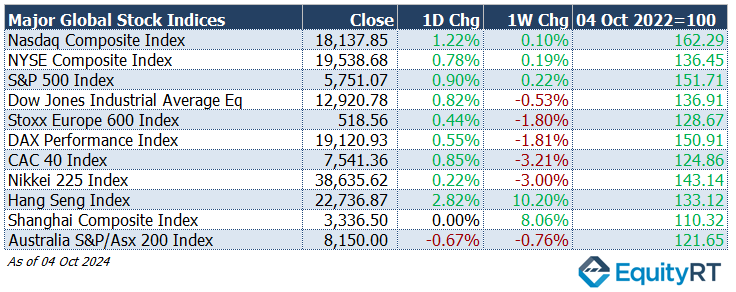
- Nasdaq Composite Index closed at 18,137.85, up by 1.22% for the day and showing a slight 0.10% increase over the week. This index continues to reflect the tech sector’s resilience amidst broader economic challenges.
- NYSE Composite Index finished at 19,538.68, with a daily increase of 0.78% and a weekly gain of 0.19%.
- S&P 500 Index finished at 5,751.07, rising by 0.90% in a single day, and a weekly increase of 0.22%.
- Dow Jones Industrial Average EW closed at 12,920.78, reflecting a 0.82% daily gain but down 0.53% for the week.
Europe’s major stock markets experienced varied performances amid geopolitical tensions and investor sentiment influenced by U.S. job data:
- Stoxx Europe 600 Index finished at 518.56, with a 0.44% daily gain but a 1.80% decline over the week, showing the impact of geopolitical tensions in Europe.
- DAX Performance Index closed at 19,120.93, up by 0.55% daily but down 1.81% weekly.
- CAC-40 Index ended at 7,541.36, increasing by 0.85% for the day while experiencing a 3.21% decline over the week, reflecting investor concerns about French economic indicators.
Asian stock markets displayed a mixed performance. The Hang Seng Index in Hong Kong stood out, reaching a new high which reflected positive sentiment among investors. This was largely driven by renewed confidence in China’s property sector, spurred by recent stimulus measures that improved investor outlook on property developers and offshore bond:
- Hang Seng Index achieved significant gains, closing at 22,736.87, up by 2.82% for the day and an impressive 10.20% for the week, benefiting from optimistic economic data.
- Shanghai Composite Index rose by 2.88%, finishing at 3,087.53, with a notable 12.81% weekly rise.
- Nikkei 225 Index closed at 38,635.62, rising by 0.22% daily and facing a 3.00% decline for the week, influenced by market reactions to domestic economic policies.
- Australia’s S&P/ASX 200 Index closed at 8,150.00, down 0.67% for the day and a 0.76% decline weekly, as concerns about global trade impact Australian equities.
The Dollar Index (#DXY), a closely watched gauge of the U.S. dollar’s performance against other major currencies, closed at 102.49, increasing by 0.50% for the day and 2.06% for the week, indicating a stronger dollar, likely driven by rising interest rates and economic data supporting a robust U.S. economy.
The Brent crude oil (#LCO07) the global oil price benchmark, priced at $78.05 per barrel, up 0.55% for the day and significantly up 9.10% for the week. The rising oil prices may be attributed to geopolitical tensions and supply chain concerns, particularly in light of recent Middle East developments.
The price of gold (#XAU) ) closed at $2,652.75, slightly down by 0.11% for the day and 0.21% for the week. Despite the minor decline, gold remains a critical safe-haven asset amidst market volatility.
The 2-year U.S. Treasury yield (#USGG2YR), particularly responsive to Federal Reserve policy rates, increased significantly by 21.20 basis points to 3.93%.
The 10-year U.S. Treasury yield (#USGG10YR) rose by 11.00 basis points to 3.96%.

Take the Guesswork out of Investing: Backtest Your Strategies with Ease!
U.S. Economic Indicators: Last Week’s Macro Highlights
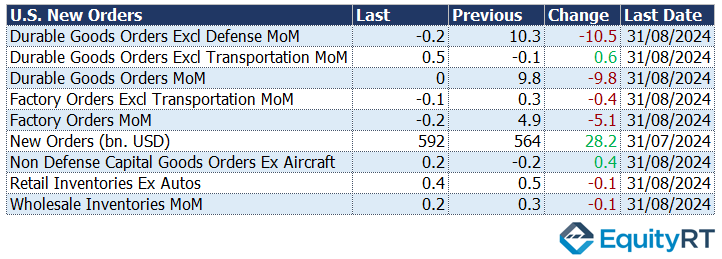
Following a substantial increase of 9.8% in July, durable goods orders remained flat at 0% in August, aligning with preliminary data. Additionally, core capital goods orders—excluding defense and indicating business investment—were revised upward from a 0.2% increase to 0.3%, showing signs of recovery after a 0.3% decline in July.
Factory orders experienced a slight decline of 0.2% in August, following a significant 4.9% increase in July. This result was weaker than expectations, which had predicted a modest rise of 0.1%.
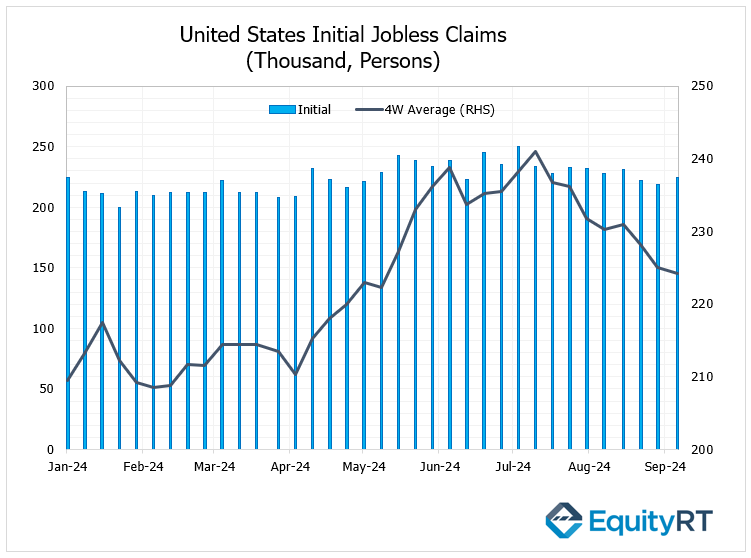
In the United States, the weekly jobless claims for the week ending September 28 saw a slight increase, rising from 219,000 to 225,000, slightly exceeding expectations. This marked the highest level recorded in the past three weeks, although the figures remain low compared to historical averages. Additionally, the 4-week average of jobless claims decreased to 224.25 thousand, down from a revised 225 thousand in the previous week, representing the lowest reading in 17 weeks.
Unleash Your Investment Potential. EquityRT might be the missing puzzle piece to reach your ultimate investment strategy.
Upcoming U.S. Economic Indicators to Watch This Week
In the United States, key economic indicators are set to dominate the agenda, including the Consumer Price Index (CPI) figures, the minutes from the Federal Open Market Committee (FOMC), and the commencement of the earnings season.
On Thursday, inflation data in the U.S. will be closely monitored by investors. Analysts anticipate that annual inflation will decelerate to 2.3% in September, marking the lowest level since February 2021. The headline CPI is projected to increase by 0.1% month-over-month, a decrease from the 0.2% rise seen in August. Furthermore, core CPI is expected to show a 0.2% increase, down from 0.3% in the previous month.
In August 2024, the annual inflation rate in the United States decelerated for the fifth straight month, reaching 2.5%, its lowest level since February 2021. This represents a drop from 2.9% in July and came in below expectations of 2.6%. On a month-over-month basis, the Consumer Price Index (CPI) increased by 0.2%, consistent with the rise in July and in line with forecasts. A key contributor to the monthly inflation rise was the shelter index, which climbed by 0.5%.
Core inflation remained stable at 3.2%, marking its lowest annual rate in over three years. However, the monthly core inflation ticked up slightly to 0.3%, surpassing the predicted 0.2%.
This steady decline in inflation reflects a cooling of price pressures in the broader economy while core components like shelter continue to contribute to monthly gains.
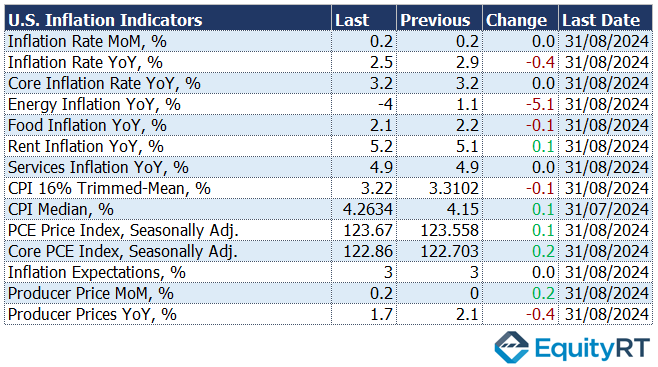
The Producer Price Index (PPI) is also forecasted to rise by 0.1%, while core PPI is anticipated to climb by 0.2%.
Investors will pay close attention to the preliminary data for Michigan’s consumer sentiment, trade balance, and the NFIB Business Optimism Index.
The release of the FOMC minutes is expected to provide clarity on the anticipated scale of the Federal Reserve’s next rate adjustment, especially after a robust jobs report that has moderated expectations for a significant 50 basis point cut. Additionally, appearances by various Fed officials are likely to be scrutinized for further insights.
On the corporate side, the third-quarter earnings season kicks off with major banks like JPMorgan, Wells Fargo, and Bank of New York Mellon scheduled to report on Friday.
In other regions of the Americas, investors will be looking for trade and labor statistics from Canada, as well as inflation figures from Brazil and Mexico.
Take the Guesswork out of Investing: Backtest Your Strategies with Ease!
European Economic Trends: Last Week’s Macro Insights
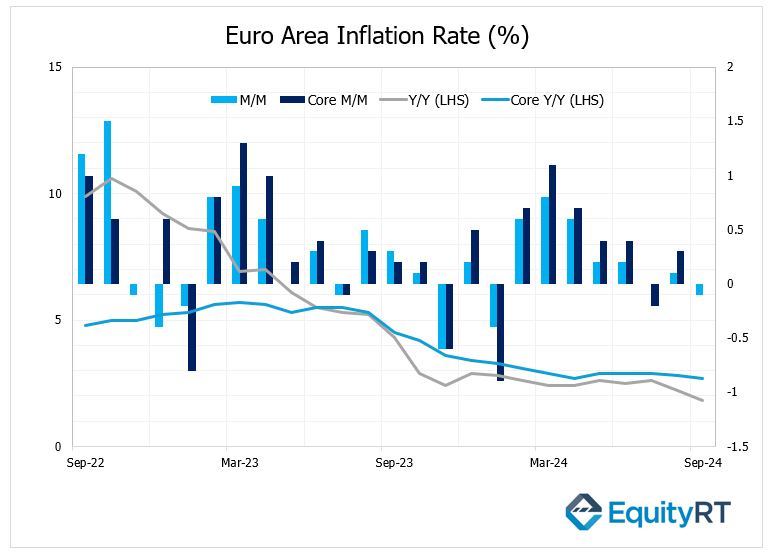
The headline Consumer Price Index (CPI) in the Euro Area showed a decline of 0.1% in September after a 0.1% increase in August, falling below expectations (0%). On a year-over-year basis, the headline CPI decreased from 2.2% in August to 1.8% in September, marking the lowest level recorded since April 2021 and representing the first instance since 2021 that it has fallen below the ECB’s target of 2%.
Additionally, the core CPI also saw a slight decrease, declining from 2.8% in August to 2.7% in September, the lowest level in the past five months.
The recent figures suggested a cooling inflationary trend in the Euro Area, which could influence the ECB’s monetary policy decisions moving forward.
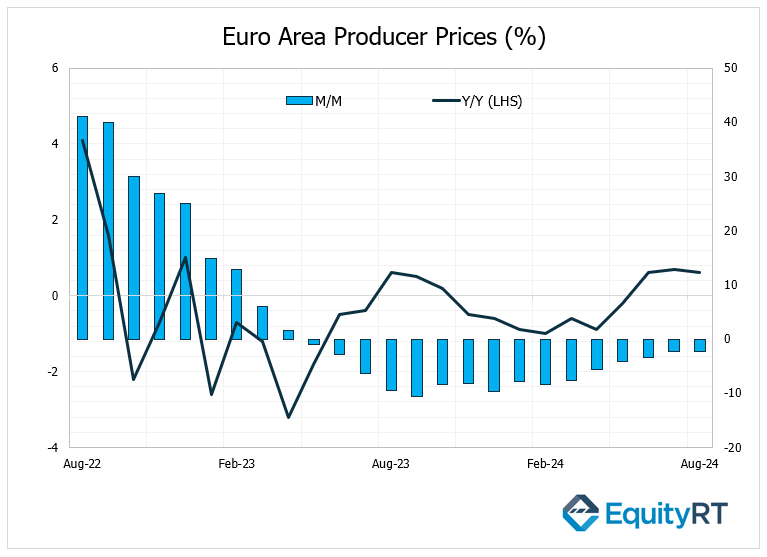
In the Euro Area, the Producer Price Index (PPI) data for August was closely monitored. Following a monthly increase of 0.7% in July, the PPI rose by 0.6% in August, slightly surpassing expectations of 0.5%. This marked the third consecutive month of increases. However, on an annual basis, the rate of decline in PPI accelerated from 2.2% to 2.3%, continuing its downward trend over the past sixteen months. The increase in PPI for August was significantly influenced by a notable rise in energy product prices, which saw an increase of 1.9%.
Unleash Your Investment Potential. EquityRT might be the missing puzzle piece to reach your ultimate investment strategy.
European Economic Trends: This Week’s Macro Insights
In Europe, the ECB will publish the minutes from its recent monetary policy meeting on Thursday. After cutting borrowing costs by 25 basis points in September, which marked the second reduction of the year, another cut is anticipated this month.
On the macroeconomic front, Germany’s factory orders are expected to decline after two months of growth, though industrial production is likely to see an upward move.
Additionally, Germany’s trade surplus is projected to expand after hitting its lowest level since December 2022.
Across the Euro Area, retail sales are forecasted to rise for the second consecutive month.
Inflation in Russia is projected to decrease to a four-month low.
Other forthcoming data includes Germany’s retail sales and final inflation figures, France’s trade balance, and Switzerland’s consumer confidence.
In the UK, monthly GDP figures are expected to indicate economic growth in August, accompanied by rebounds in industrial and manufacturing output. Investors will also monitor the foreign trade balance and construction output.
Take the Guesswork out of Investing: Backtest Your Strategies with Ease!
Asian Economic Data: This Week’s Outlook
In Asia, China will see a quieter week as markets reopen following the Golden Week holiday.
In Japan, investors are looking forward to the October Tankan index, which will provide initial insights into the Bank of Japan’s (BoJ) future decisions.
Japan will also release its current account data for August.
In India, the Reserve Bank of India (RBI) is expected to maintain its repo rate at 6.5%, delaying any cuts due to ongoing inflation concerns.
Conversely, the Bank of Korea is set to implement its first rate cut in over four years. The Bank of Korea kept its base rate steady at 3.5% for the 13th consecutive time in August, aligning with expectations.
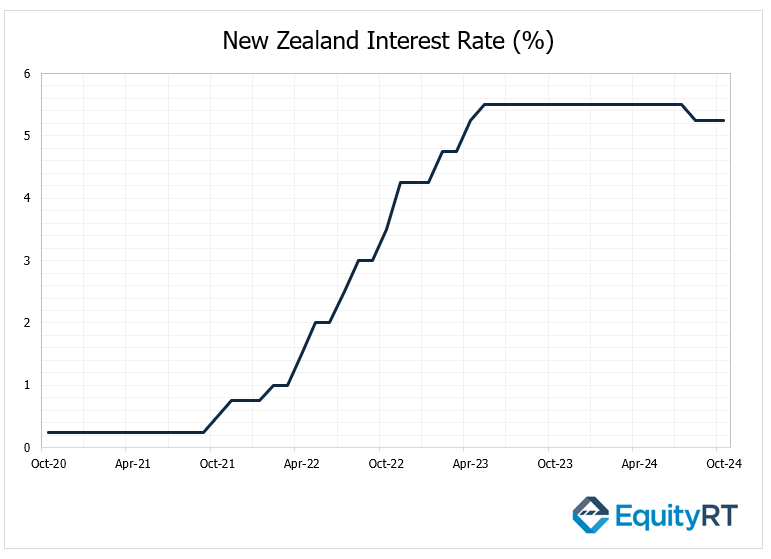
On Wednesday, the Reserve Bank of New Zealand (RBNZ) is anticipated to make another cut to its policy rate, although market opinions vary regarding the extent of this reduction.
In August 2024, the RBNZ unexpectedly cut its official cash rate (OCR) by 25 basis points to 5.25%, marking the first rate reduction since March 2020. This move surprised markets, which had expected the bank to maintain rates for a ninth consecutive meeting.
The decision followed a slowdown in New Zealand’s inflation, which dropped to 3.3% in Q2 2024, down from 4% in the previous quarter, and below the forecasted 3.5%. This lower inflation rate, the weakest since Q2 2021, brought inflation back within the central bank’s target range of 1-3%.
In Australia, a busier week includes the release of minutes from the Reserve Bank of Australia (RBA) meeting, alongside the Westpac consumer confidence index for October and the NAB business confidence index for September.
Other key announcements will come from the Philippines, which will report its unemployment rate.
