Global Stock Market Highlights
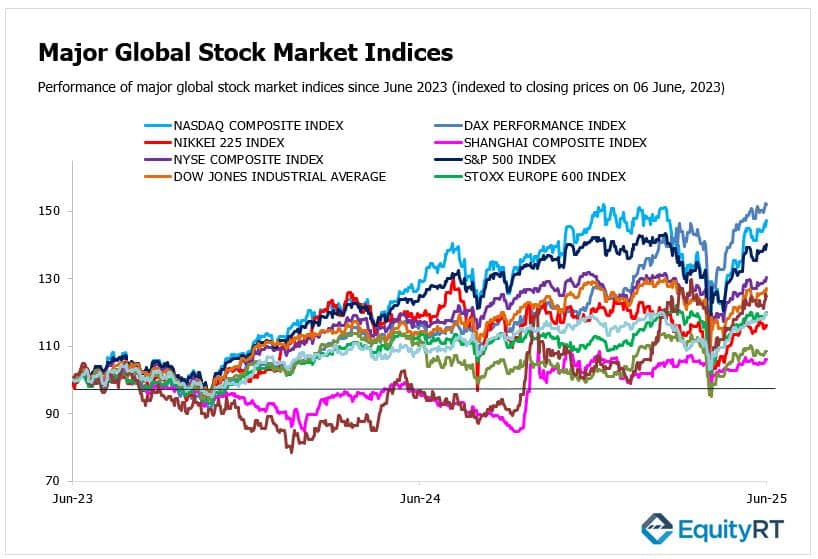
Last Friday, Wall Street ended on a positive note after a stronger-than-expected U.S. jobs report boosted investor confidence. Although hiring slowed, employers still added a solid 139,000 jobs in May, reflecting steady labor market resilience despite ongoing concerns over President Donald Trump’s trade policies. Markets also responded positively to Trump’s announcement that three of his cabinet members will meet with Chinese officials in London on June 9 to resume trade deal discussions.
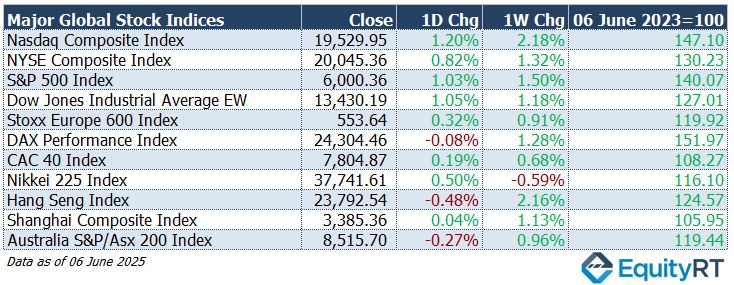
- Nasdaq Composite Index closed at 19,529.95, up 1.20% on the day and up 2.18% for the week.
- NYSE Composite Index closed at 20,045.36, up 0.82% on the day and up 1.32% for the week.
- S&P 500 Index closed at 6,000.36, up 1.03% on the day and up 1.50% for the week.
- Dow Jones Industrial Average EW closed at 13,430.19, up 1.05% on the day and up 1.18% for the week.
On Friday, investors remained cautious ahead of the release of U.S. jobs data and amid lingering trade uncertainties. While the European Central Bank lowered interest rates earlier in the week, ECB President Christine Lagarde signalled that further monetary easing may be limited, tempering hopes for more aggressive stimulus measures.
- Stoxx Europe 600 Index closed at 553.64, up 0.32% on the day and up 0.91% for the week.
- DAX Performance Index closed at 24,304.46, down 0.08% on the day but up 1.28% for the week.
- CAC 40 Index closed at 7,804.87, up 0.19% on the day and up 0.68% for the week.
Markets responded to the anticipation of U.S. jobs data and viewed the latest U.S.–China communications as somewhat reassuring, though lacking any concrete progress. Investor sentiment remained cautious in mainland China and Hong Kong, with participants awaiting clearer signals from diplomatic talks expected later in the week.
- Nikkei 225 Index closed at 37,741.61, up 0.50% on the day but down 0.59% for the week.
- Hang Seng Index closed at 23,792.54, down 0.48% on the day but up 2.16% for the week.
- Shanghai Composite Index closed at 3,385.36, up 0.04% on the day and up 1.13% for the week.
- Australia S&P/ASX 200 Index closed at 8,515.70, down 0.27% on the day but up 0.96% for the week.
- The Dollar Index (DXY), a closely watched gauge of the U.S. dollar’s performance against other major currencies, closed at 99.19, up 0.48% on the day, down 0.14% for the week, and down 8.54% year-to-date.
- The Brent crude oil, the global oil price benchmark, settled at $66.47 per barrel, gaining 1.73% on the day, up 5.88% for the week, but down 10.95% year-to-date.
- The Gold closed at $3,309.95 per ounce, down 1.28% on the day, up 0.63% for the week, and up a notable 26.12% year-to-date.
- The 2-year U.S. Treasury yield particularly responsive to Federal Reserve policy rates, rose to 4.05%, gaining 11.70 bps on the day and 13.70 bps for the week.
- The 10-year U.S. Treasury yield an indicator of long-term borrowing costs, closed at 4.51%, up 12.10 bps on the day and 10.40 bps for the week.

Take the Guesswork out of Investing: Backtest Your Strategies with Ease!
Upcoming U.S. Economic Indicators to Watch This Week
This week, markets will remain sensitive to developments in U.S. trade negotiations, particularly any updates from the anticipated meeting between American and Chinese officials in London. Meanwhile, attention is also turning to the emerging rift between President Trump and Elon Musk, which could introduce further unpredictability into U.S. policy and market sentiment.
Economic data from the U.S. will be relatively light but critical. On Wednesday, the spotlight will be on inflation figures, with both CPI and PPI set to provide fresh clues about price trends.
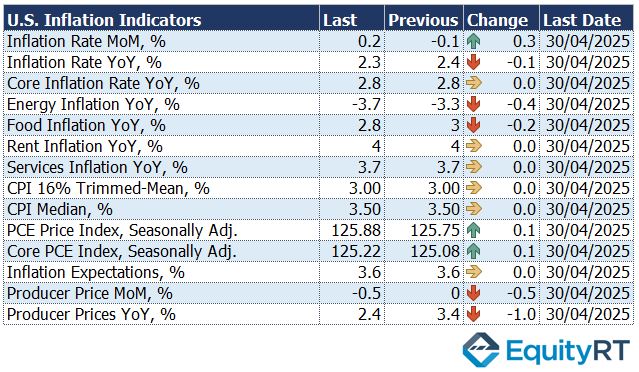
Headline CPI is expected to remain stable at 2.3%, the lowest reading since early 2021, while core CPI and PPI are forecast to rise modestly. These data will feed into expectations for future Fed policy.
In April 2025, the US Consumer Price Index (CPI) rose 0.2% month-over-month, rebounding from a 0.1% decline in March but below the expected 0.3%.
The annual inflation rate eased to 2.3%, the lowest since February 2021, with declines in energy, food, and transportation inflation.
Rent inflation remained unchanged at 4% while energy prices dropped by 3.7% year-on-year in April 2025, following a 3.3% decline in the previous month.
Food prices eased to 2.8%, down from a nearly 1.5-year high of 3% recorded in March.
Core inflation, excluding food and energy, remained steady at 2.8% annually, its four-year low, with monthly core prices rising 0.2%.
The University of Michigan Consumer Sentiment reading will also be watched closely, particularly for signals on future spending behaviour.
Meanwhile, the monthly budget statement and jobless claims will offer further insight into fiscal conditions and labor market dynamics.
Across the region, Mexico and Brazil are set to release their latest inflation data, which may influence central bank expectations. Brazil will also report on retail sales and business sentiment, shedding light on domestic demand resilience amid global uncertainty.
Unleash Your Investment Potential. EquityRT might be the missing puzzle piece to reach your ultimate investment strategy.
European Economic Trends: This Week’s Macro Insights
In the UK, a slew of data releases may reinforce growing concerns about economic momentum. April GDP is expected to show the first contraction in half a year, weighed down by continued weakness in industrial output.
The unemployment rate is projected to edge up to 4.6%, its highest level since 2021, while wage growth is seen holding at 5.5%. These figures arrive ahead of the government’s Spending Review on June 11, where Chancellor Rachel Reeves will outline fiscal priorities for the years ahead.
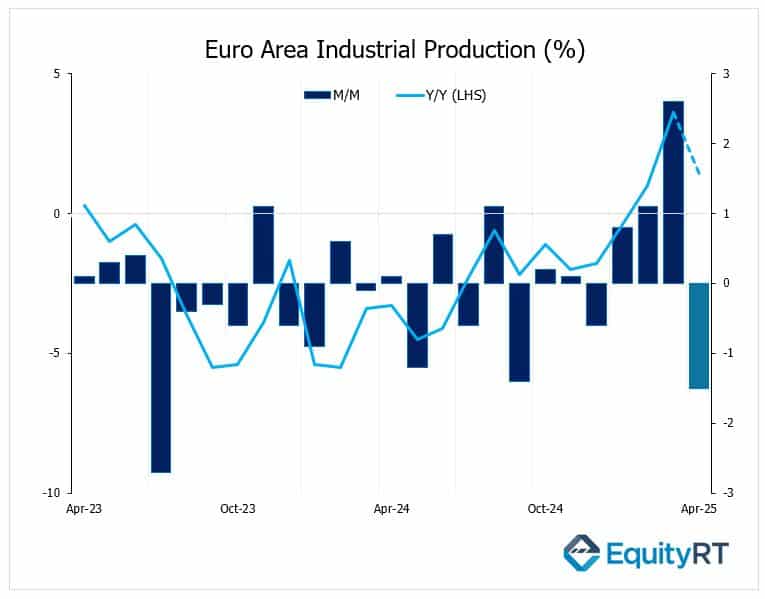
Elsewhere in Europe, attention will turn to Euro Area industrial production, German wholesale prices, Italy’s industrial output and trade balance, and Russia’s inflation figures.
Industrial production in the Euro Area rose by 3.6% in March 2025 compared to the same month a year earlier. On a monthly basis, it increased by 2.6%.
Take the Guesswork out of Investing: Backtest Your Strategies with Ease!
Asian Economic Data: This Week’s Outlook
In China, investors monitored foreign trade data amid persistent uncertainty over tariffs. China’s exports rose 4.8% year-on-year in May 2025, below the 5% forecast and down from April’s 8.1% growth, marking the weakest gain in three months. A sharp 34.5% drop in exports to the U.S., the steepest in over five years, dragged overall performance amid ongoing tariff tensions. Imports fell 3.4% to $212.9 billion, a deeper decline than expected, driven by weak domestic demand and continued U.S. tariffs. Imports from the U.S. plunged 18%. Despite a 90-day trade truce and a preliminary deal to ease tariffs, recent tensions have flared again over alleged violations.
Meanwhile, China’s consumer prices fell 0.1% year-on-year in May 2025, the fourth consecutive month of deflation. The decline matched April’s drop and was slightly better than the expected 0.2% decrease, reflecting persistent pressure from weak domestic demand, trade tensions with the U.S., and job market concerns.
Japan’s economy shrank 0.2% annualized in Q1 2025, a smaller decline than the earlier estimate of 0.7%. However, it marked the first annual contraction in a year and a sharp pullback from the revised 2.2% growth in Q4. The slowdown was driven in part by weaker net exports, as uncertainty over U.S. trade policy and potential auto tariffs weighed on Japan’s key manufacturing sector.
Key additional releases included the current account, producer prices, and business sentiment surveys.
In India, inflation is also anticipated to ease further, supporting expectations that the central bank may maintain a dovish stance.
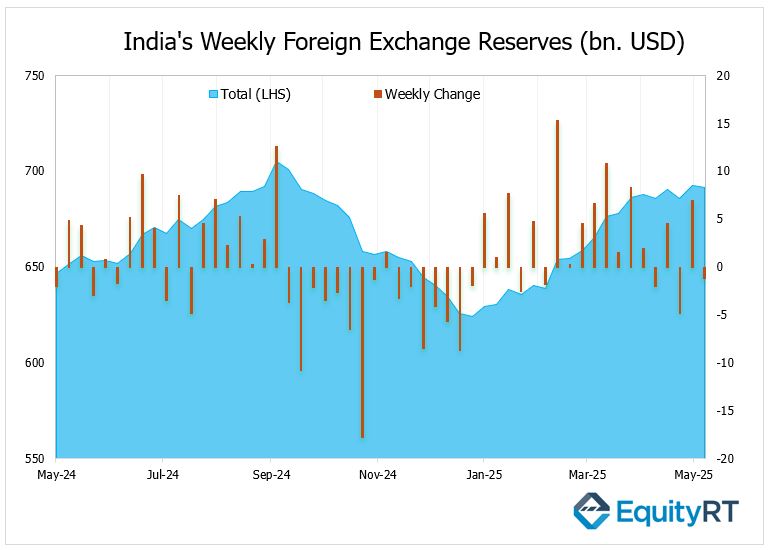
Investors will be watching closely the latest foreign exchange reserve data is officially released on Friday.
India’s foreign exchange reserves fell to $691.5 billion as of May 30, down $1.2 billion from the previous week and $13.4 billion below the September 2024 peak. Despite the dip, reserves remain strong enough to cover over 11 months of imports and 96% of external debt. The rupee weakened slightly to 85.8050 per dollar amid U.S. tariff concerns, while the Reserve Bank of India (RBI) cut its repo rate by 50 basis points and eased the reserve ratio.
In Australia, the focus will be on NAB Business Confidence and Westpac Consumer Confidence to gauge sentiment amid lingering uncertainty.
