Peer Comparison
Peer and Industry Analysis
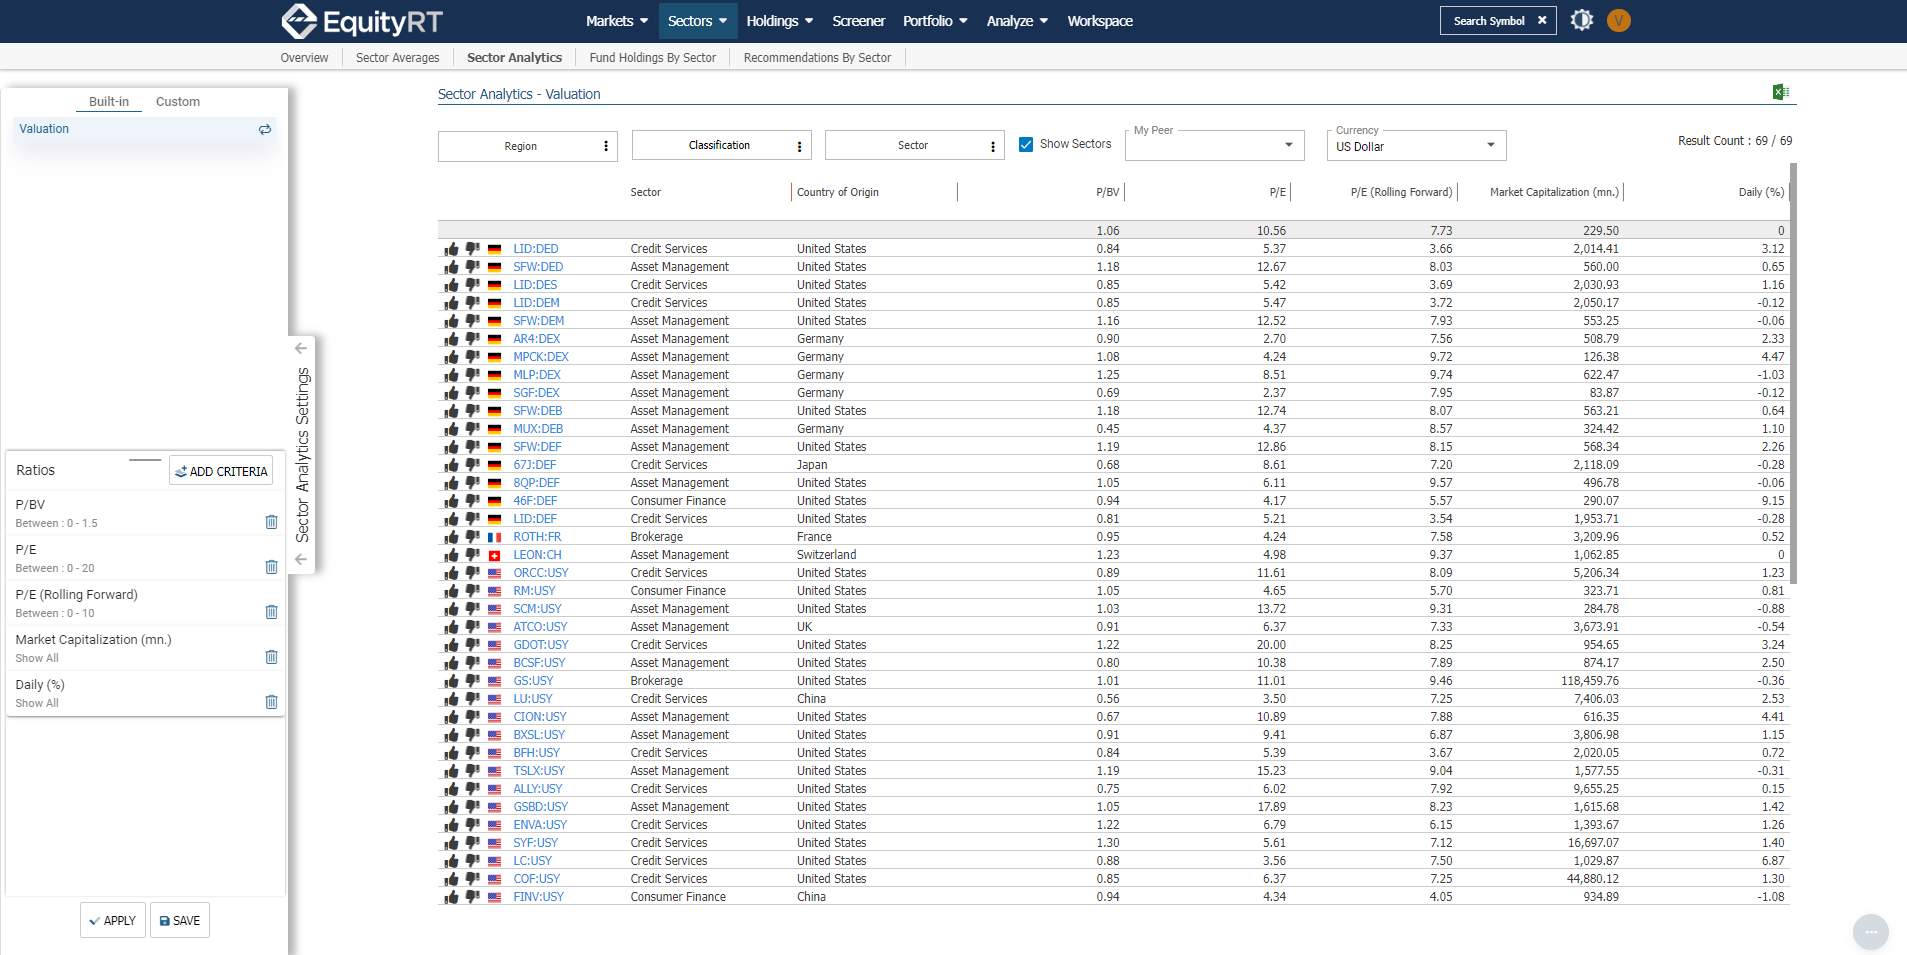
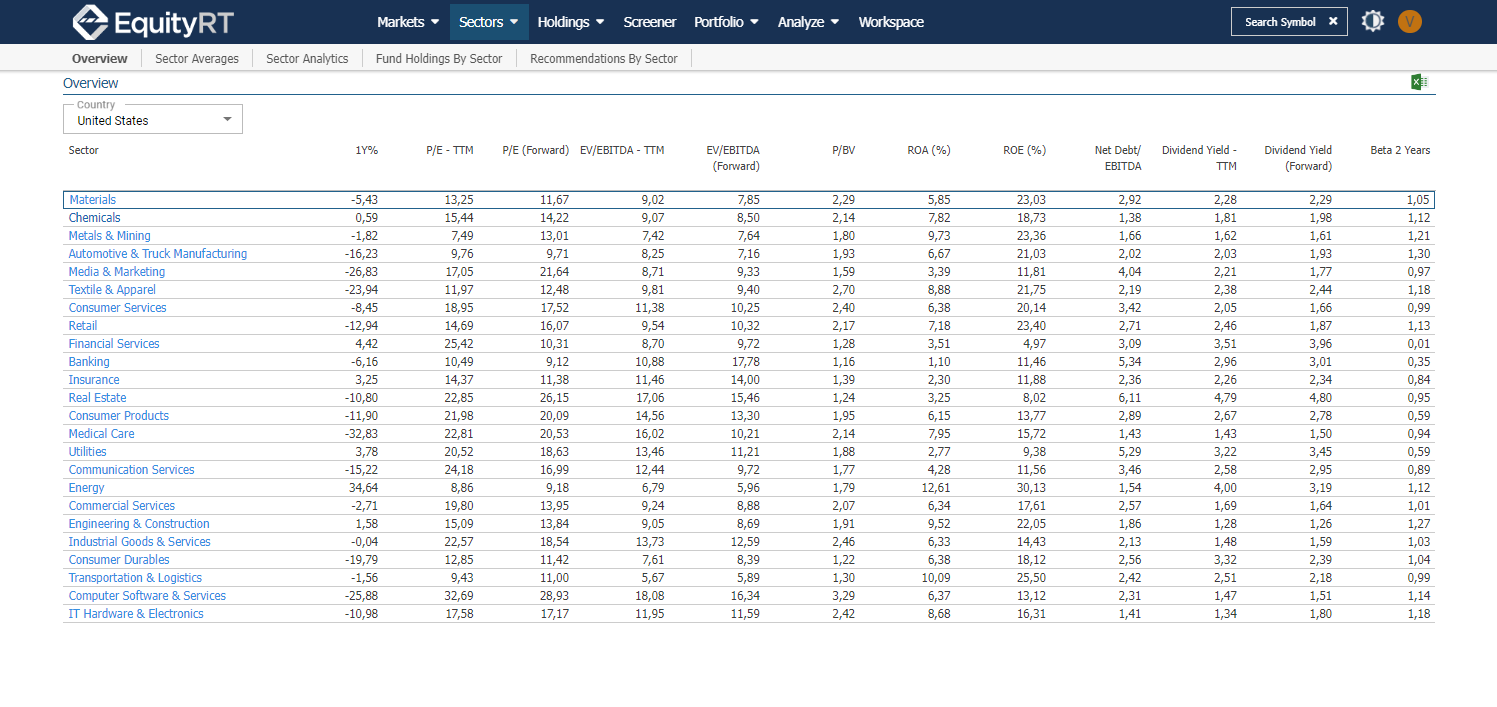
Collecting as much accurate data as possible is the core of equity analyses. Since the contemporary financial world is also interconnected, data comes from diversified sources. Diversified, accurate and up-to-date data is crucial in making investment decisions, as well as finding out new investment opportunities. And this doesn’t change when you need peer comparisons.
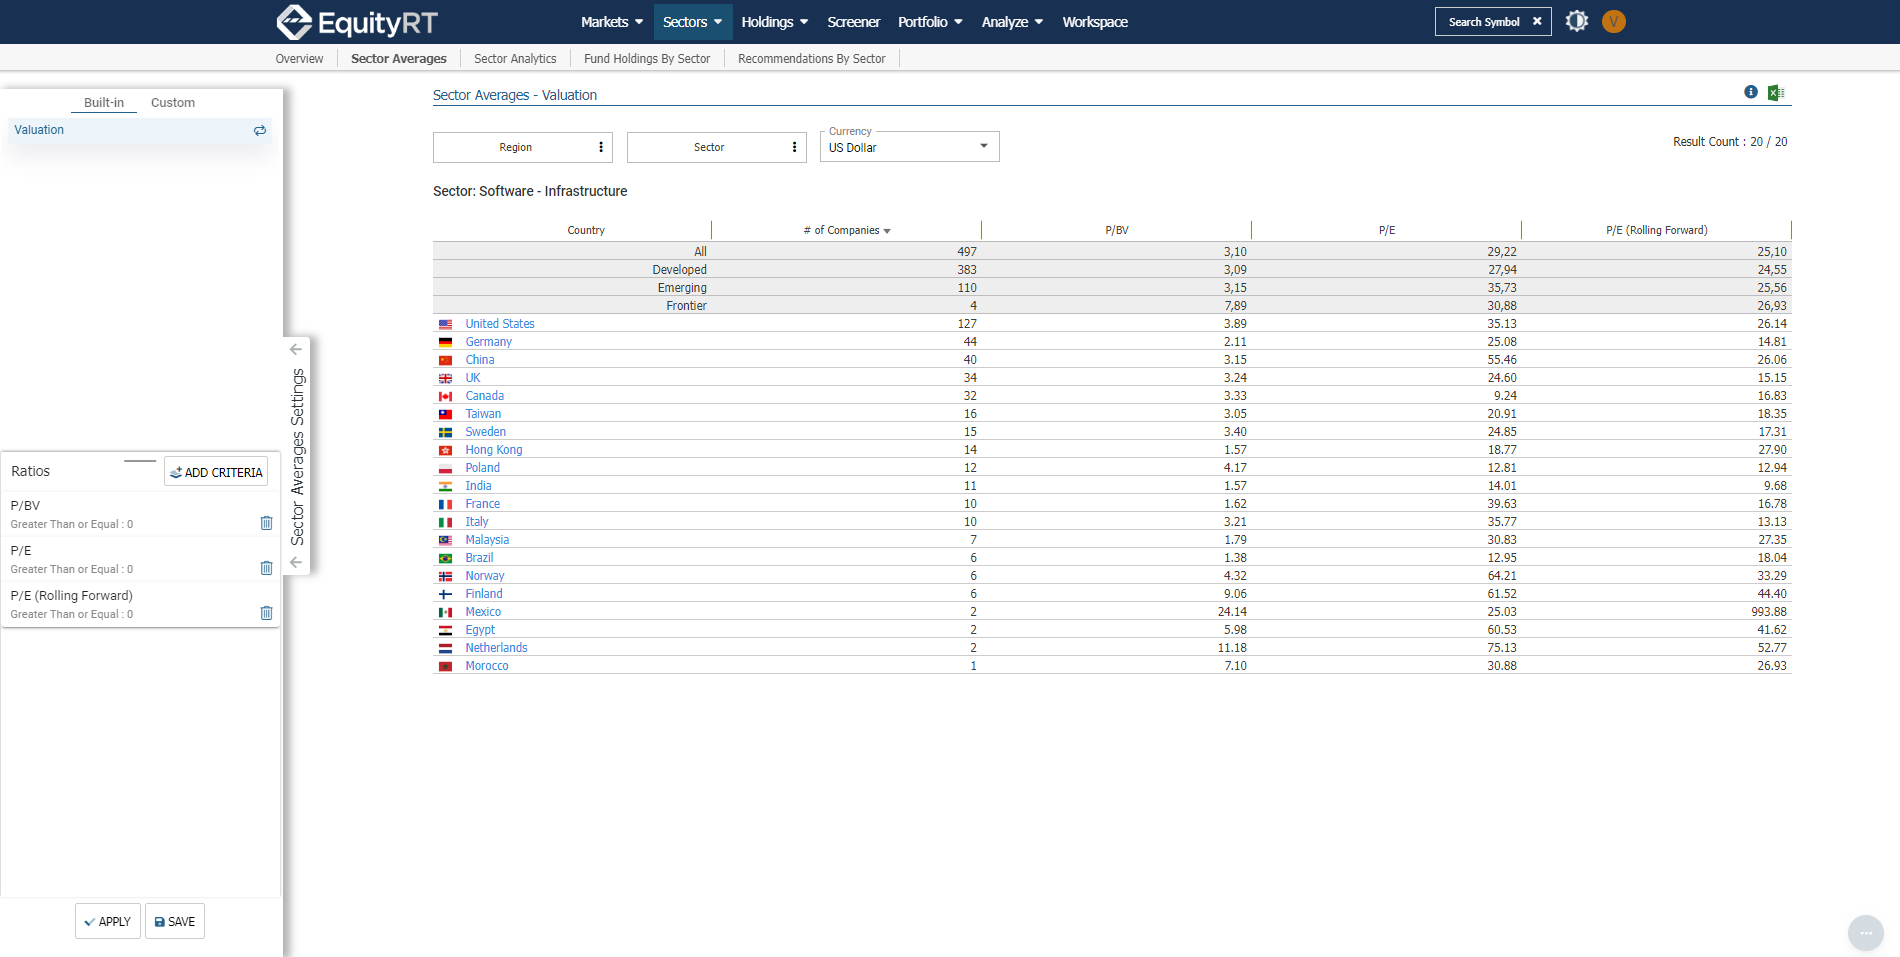
Up-to-date and Accurate Data is Essential
As one of the most widely used and accepted methods of equity analyses, peer comparison analyses are particularly effective for detecting undervalued stocks or determining the stocks which would be a good addition to a portfolio.
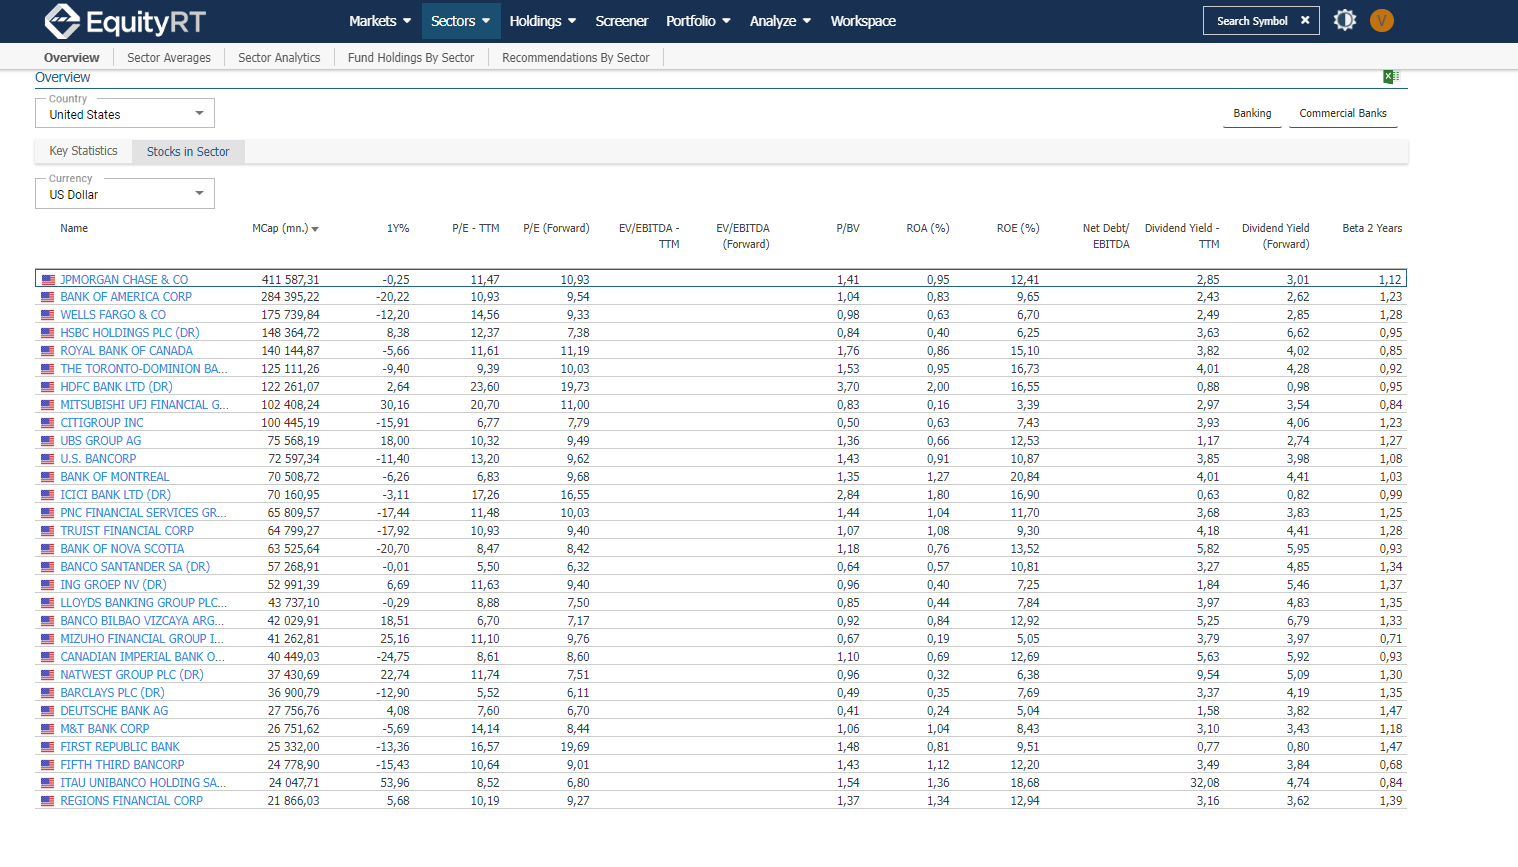
Hence the name suggests, it depends on comparison and relative valuation. The analysts not only need to have an access to extensive company coverage and but also conduct detailed analyses across regions, countries and industries. We provide dividend & corporate actions, company disclosures such as financial reports and presentations. Combined with real-time company news and comparable cross-country indicators; EquityRT enables analysts to conduct reliable peer comparison analysis. Analysts can gain essential insights into industry-sector characteristics and comparables of the listed companies in 130+ stock exchanges globally.
- Widest coverage of standardized fundamentals and corporate actions.
- Standardized financial templates using a consistent methodology across all markets.
- Meticulously formulated key ratios to be utilized for peer comparison.
Customizable Peer Groups
- Along with the pre-defined peer groups, you can easily customize the peer groups for the level of detail you require.
- Gain deeper insight into market and industry trends.
- Create custom industries, indices, and various market views for benchmarking purposes.
- Compare the stocks within the Peer Groups using ready to use analytics.
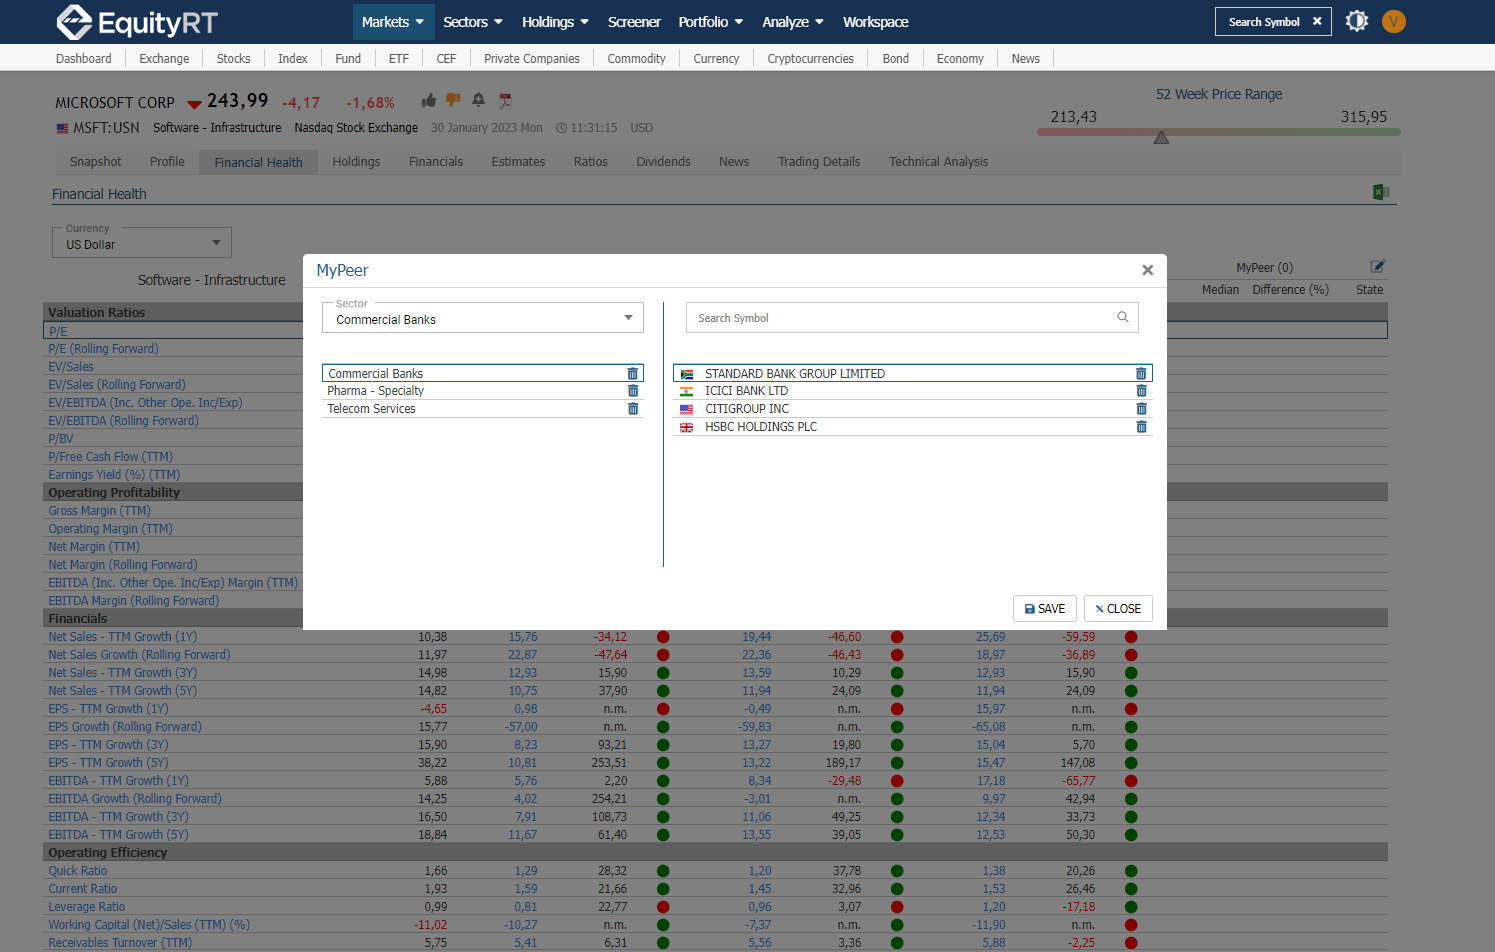
Financial Health
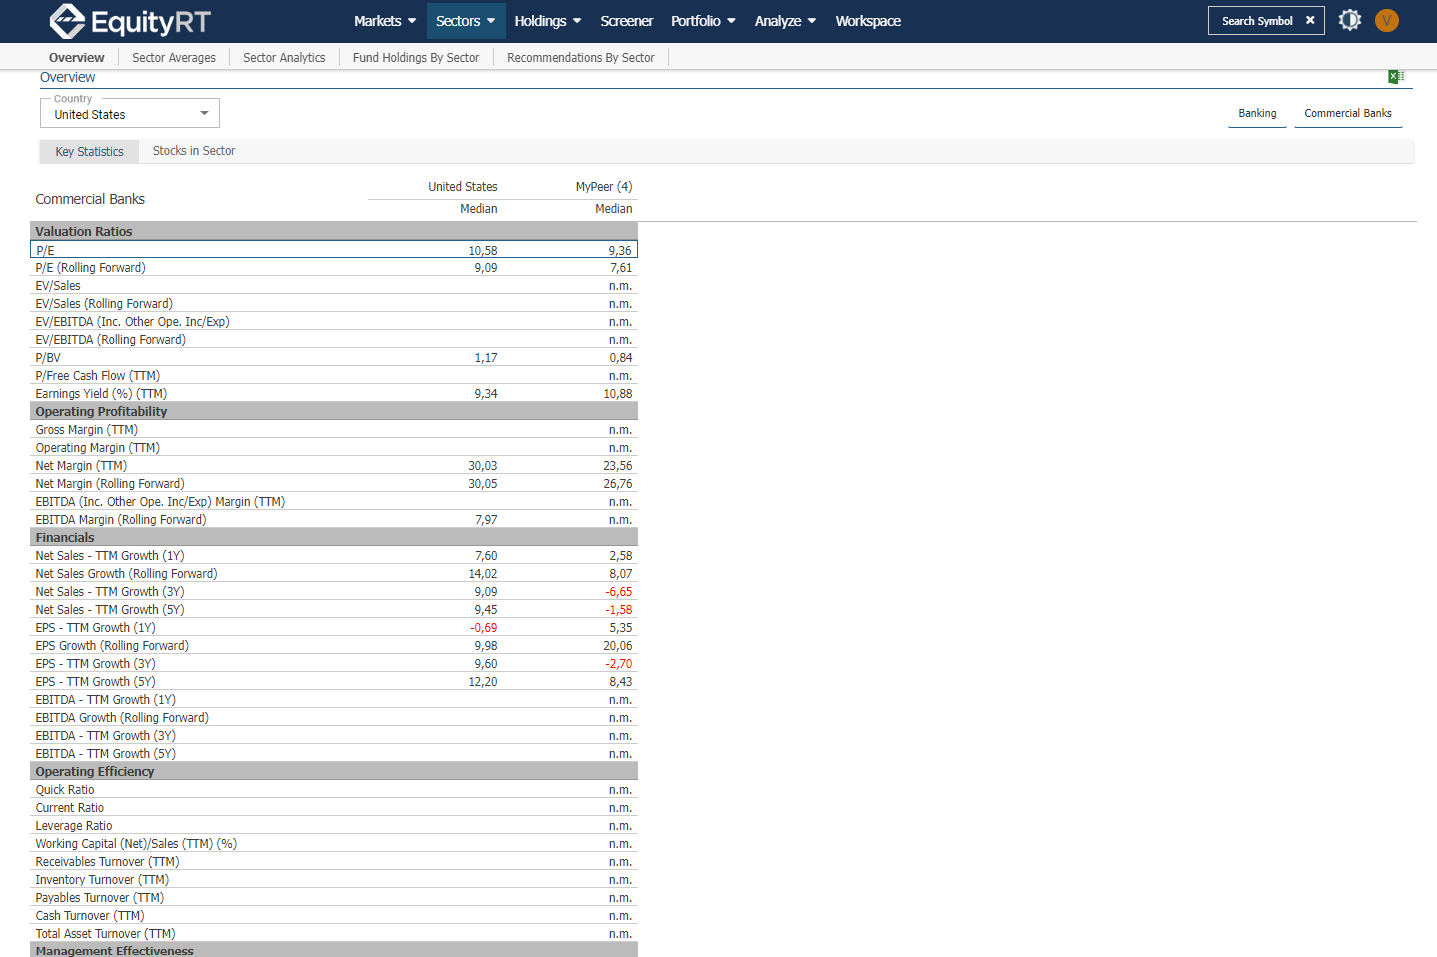
Evaluating financial health of a company is one of the most important aspects of stock analysis. Several factors must be considered to accurately evaluate a company’s financial health and sustainability. We enable you to quickly review and compare the company ratios with its peers in the World; in the related market (Developed, Emerging and Frontier Markets) and within the country to find out whether the company is outperforming or under-performing.
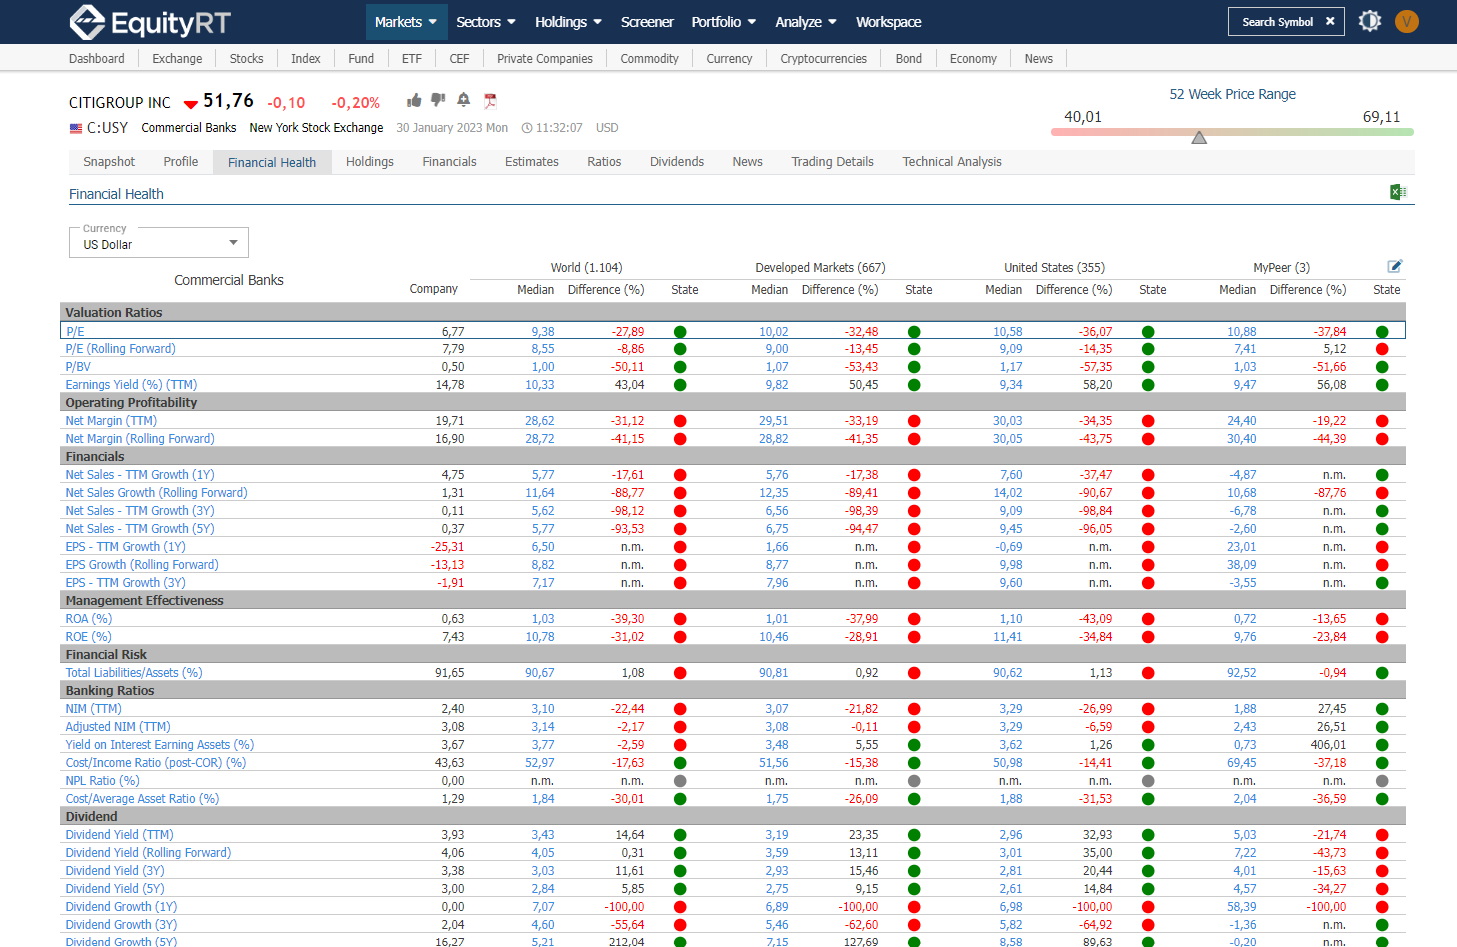
Insightful ratios grouped under the below-mentioned criteria and the consensus estimates numbers for year-end and next year are listed in a simple table format with colorful dots to visualize the status of the company compared to the peer medians. You can further check out the list of companies that make up the median.
- Valuation ratios:
P/E, EV/Sales, EV/EBITDA, EV/EBITDA (Including Other Operational Income/Expense), P/BV (Excluding goodwill), P/Free Cash Flow, Earnings Yield (%)
- Operating profitability:
Gross Margin, Operating Margin, Net Margin, Net Margin Estimated (%), EBITDA Margin, EBITDA (Including Other Operational Income/Expense) Margin, EBITDA Margin Estimated (%)
- Financials:
Change of Net Sales (%), Change of Net Sales (%) (3 Year AVG) , Net Sales Growth Estimated (%), Change of Net Profits (%), Change of Net Profits – TTM (%) (3 Year AVG), Net Profit Growth Estimated (%)
- Operating Efficiency
Quick Ratio, Current Ratio, Leverage Ratio, Working Capital (Net)/Sales (%), Receivables Turnover, Inventory Turnover, Payables Turnover, Cash Turnover, Total Asset Turnover
- Management Effectiveness:
Return on Assets, Return on Equity
- Financial Risk:
Cash Earnings/Financial Expenses, Net Debt/EBITDA (Including Other Operational Income/Expense), Total Liabilities/Assets (%)
- Dividend Ratios:
Dividend Yield (%), Dividend Yield Average (%) – 5 Years
- Banking ratios:
NIM, Adjusted NIM, Yield on Interest Earning Assets, Cost/Income Ratio, NPL Ratio, Cost/Average Asset Ratio