Advanced Charting
Data Visualization Made Easy
You seek to achieve strategic business objectives by addressing several complex issues. We help you in understanding these issues holistically and creating strategic options using our comprehensive, accurate and up-to-date data sets.
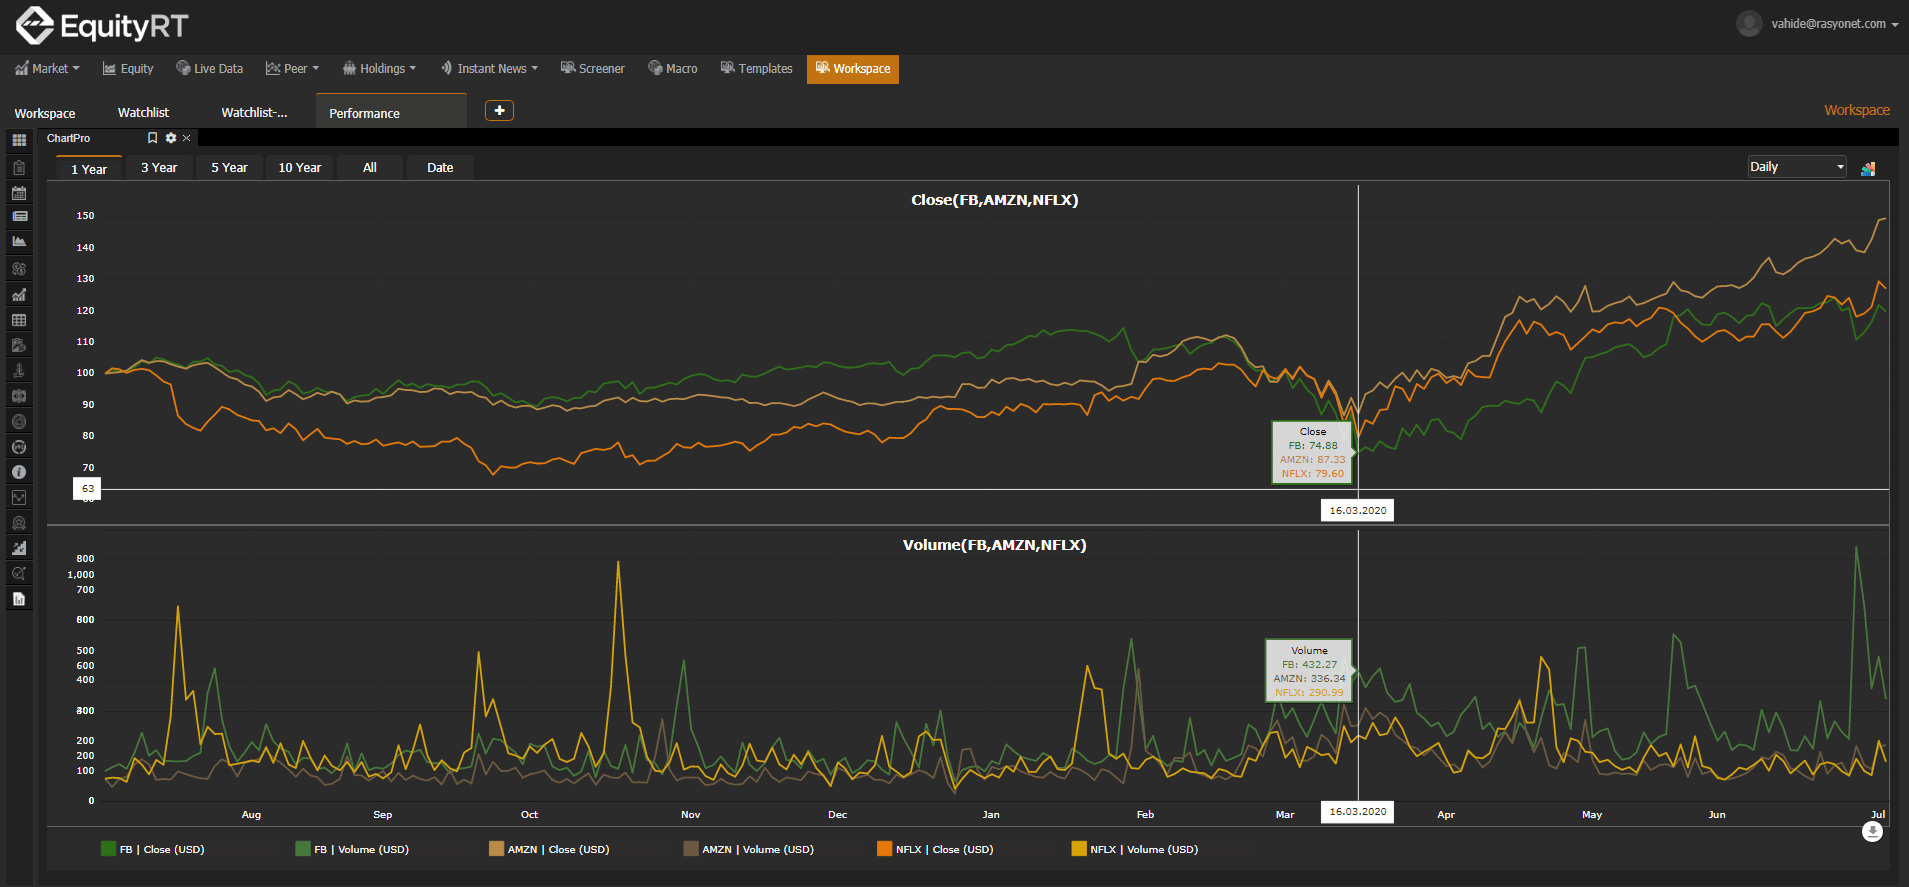
Data visualization is made easy with EquityRT ChartPro so that you can focus on addressing key insights and trends that will lead you to fully informed decisions. From company financials to indices; FX rates to inflation, commodities or funds; get an insight into the changing trends and easily compare multiple instruments on ChartPro.
What is the Difference Between Fundamental and Technical Analysis?
Both fundamental analysis and technical analysis are used to research and forecast stock prices in the future, but they are at opposite ends of the spectrum. Technical analysis uses stock charts to identify patterns and trends and the stock’s price and volume are the only inputs. Fundamental analysis, on the other hand, attempts to measure a security’s intrinsic value by examining related economic and financial factors including the balance sheet, strategic initiatives, microeconomic indicators, and consumer behaviour.

Technical Analysis
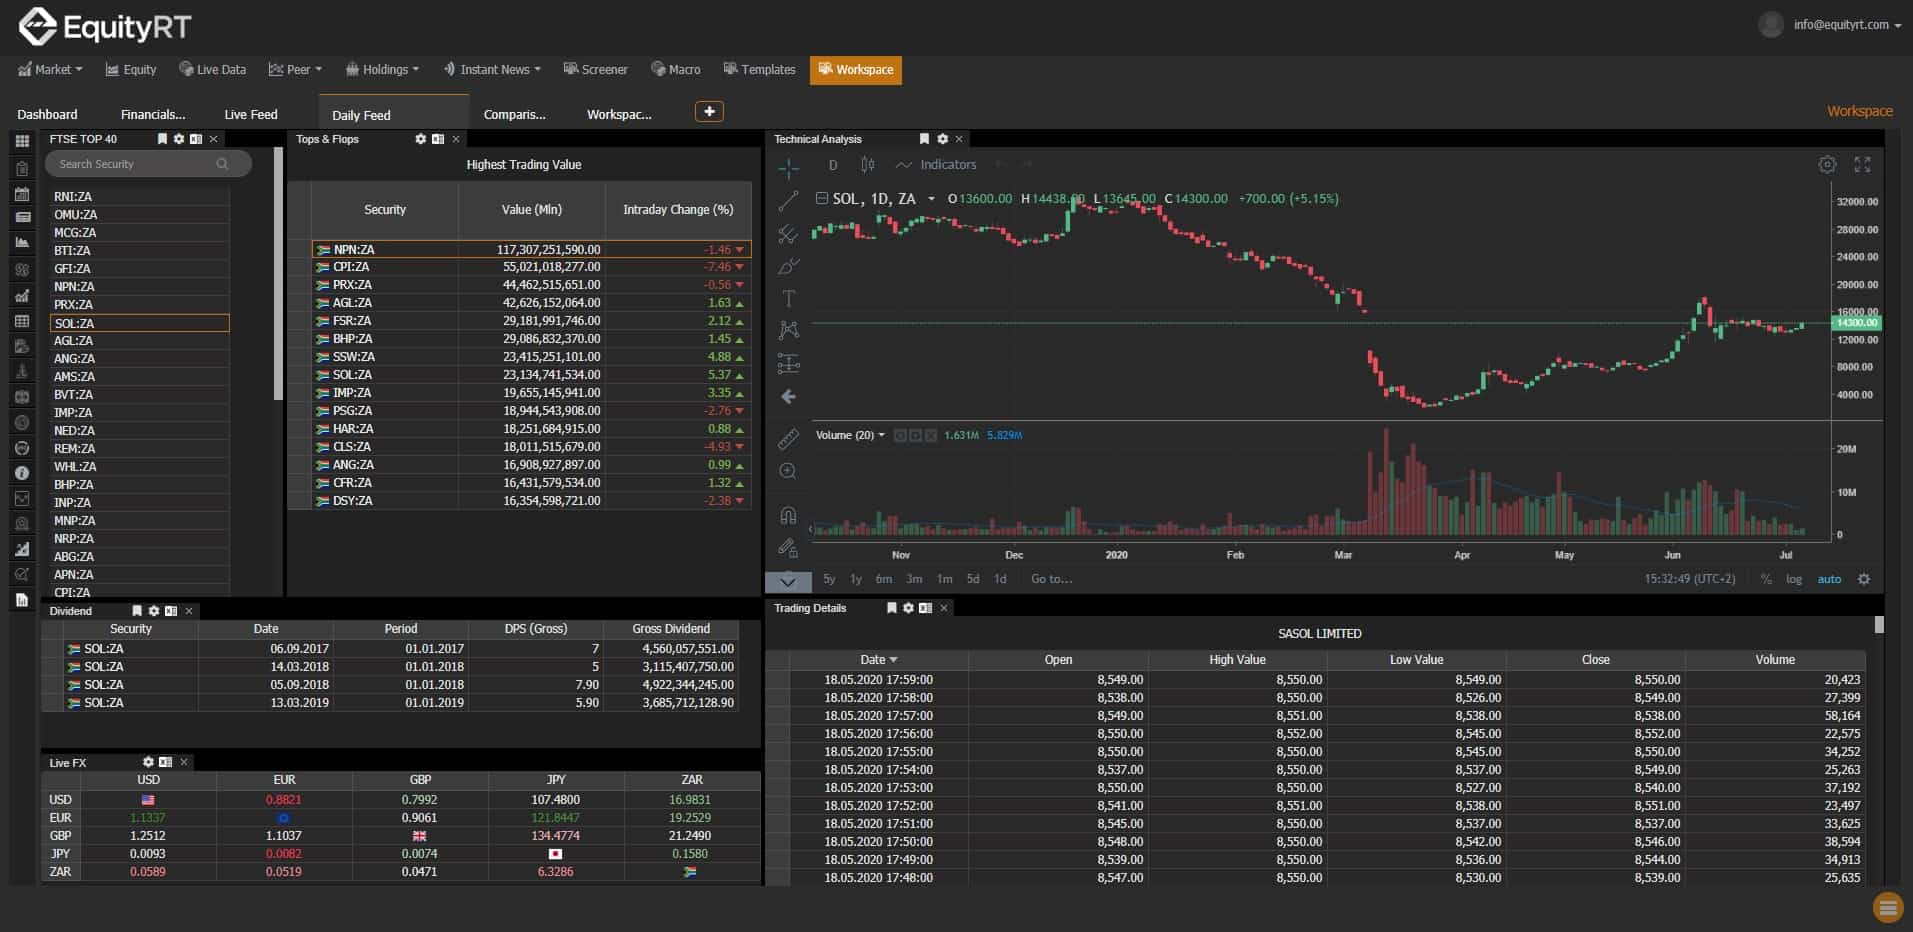
Whether it is a live data feed from an exchange or a daily price data; technical analysis chart is being used among analysts and investors for so many years. You can benefit from our reliable historical database and timely disseminated on-going data. A broad range of technical indicators and intelligent charting tools for highlighting trends, gaps, and other price patterns are provided:
- Popular indicators such as MACD, RSI, Bollinger Bands, Directional Movement, 11 different moving average methods, etc.
- Relative performance indicators including Alpha, Beta, Sharpe, Treynor, Jensen’s Alpha, Correlation, R-Squared, Relative Performance (Comparative).
- Market Breadth indicators, including Advance/Decline and New High/New Low. You can use these indicators for your watchlists and portfolios. Namely, you can create your own indices.

On-Chart Information
Directly position financials announcements, capital increases and dividend payments on technical analysis price charts within and quickly examine their effect on the price. Directly superimpose the types and dates of the events like financial announcements, capital increases and dividends on to the technical analysis charts and examine their interaction with the prices.