ANALYTICAL TOOLS
Dynamic Data Models and Reports
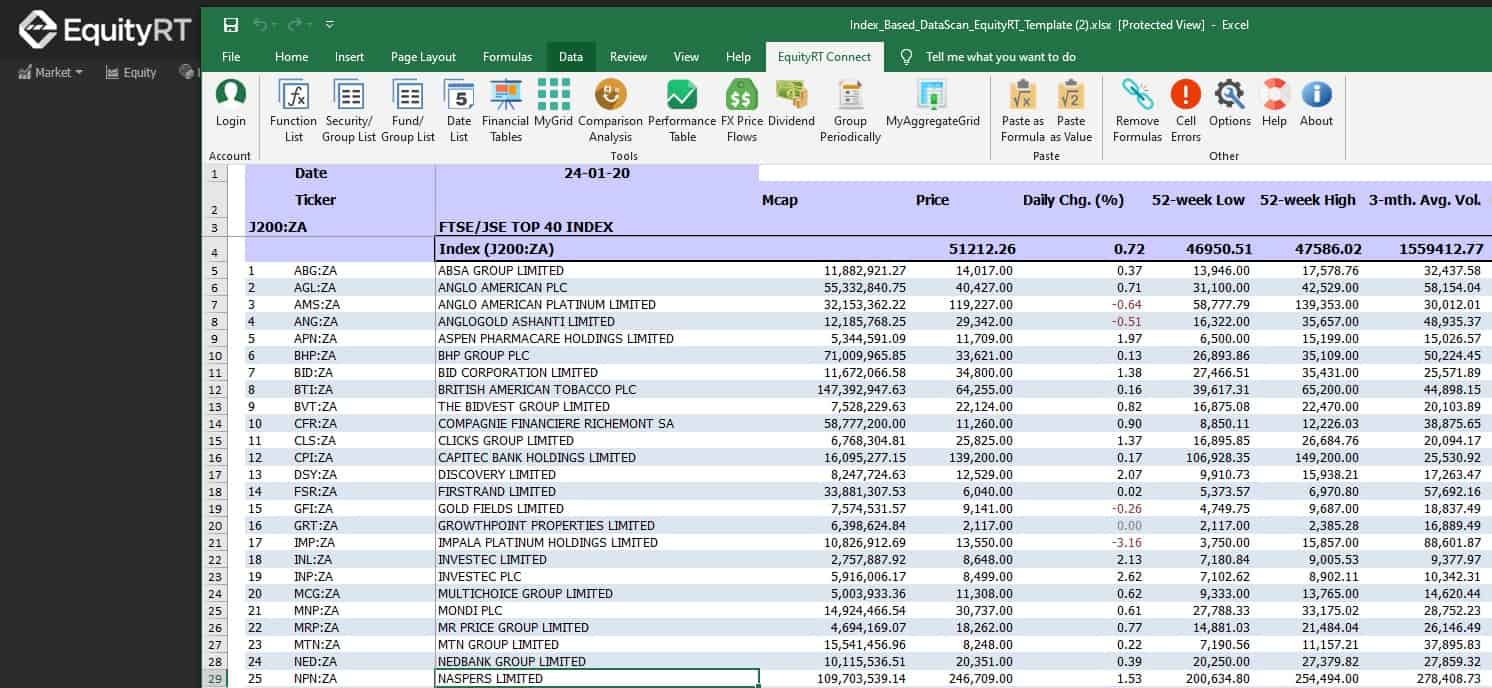
EquityRT Connect is a powerful financial data analysis module that runs as an add-in to Microsoft Excel® spreadsheet program.
With EquityRT Connect, you can retrieve various types of data points from EquityRT databases within Microsoft Excel for further calculation, formatting or charting. Our in-house data functions that are perfectly working with Excel, will ensure easy and seamless integration into your existing workflow. All you need to do is to define your parameters (security, date, currency etc.) to fetch and update the data. Save the file and open it whenever you need. All cells in your model will automatically be calculated with the latest data ensuring you are always up-to-date with the figures.
Spend More Time Doing Value-Added Research
Upgrade Your Daily Routine and Spend More Time Doing Value-Added Research
- Quickly build and maintain financial models and populate your spreadsheets and reports.
- Thousands of widely used data points per investment type are available.
- With a few clicks, pull the latest figure or download full historical data for key economic indicators worldwide
- Incorporate quarterly macro forecasts into your business plans
Ready-to-use Excel Templates
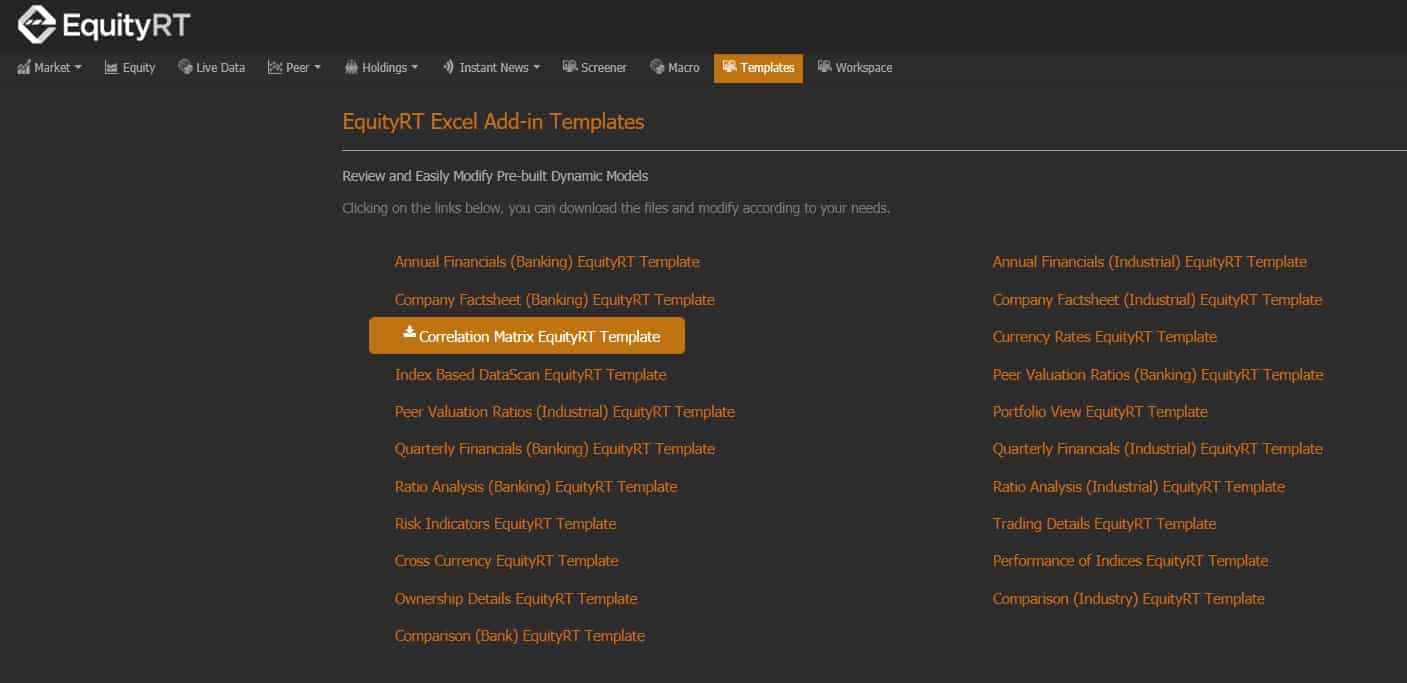
Save time with our meticulously designed pre-built Excel templates. You can start using them right away or customize for your own purposes.
- Banking Financials
- Industrial Financials
- Peer Valuation
- Company Factsheet
- Correlation Matrix
- Risk Indicators
- Cross-currency
- Portfolio Modelling
- Index Performance
- World Economic Dashboard
- PMI Heat-Map
- Country Outlook
- Global Bond Yield Matrix

